Bitcoin’s Silent Standoff: Old Money and New Hodlers Locked in Equilibrium

Bitcoin's supply dynamics have flatlined—no seismic shifts between veteran whales and fresh retail blood. The market's playing a high-stakes game of chicken, and nobody's blinking.
The Great Bitcoin Freeze
Chain analytics reveal near-zero migration between long-dormant coins and newly minted stacks. Whether it's diamond-handed OGs or cautious newcomers, both sides are bunkered down.
Liquidity Limbo
With neither cohort dumping nor accumulating aggressively, we're stuck in pricing purgatory. Traders hate it, but Bitcoin's never cared about short-term entertainment.
Maybe Wall Street's algo-traders should try staring at a blockchain explorer instead of their Bloomberg terminals—they might finally understand what real patience looks like.
Bitcoin HODL Structure Signals Equilibrium
According to top analyst Axel Adler, the Bitcoin HODL Structure and 30-day flows provide a clear picture of the current market regime. The chart tracks the share of short-term holders (STH, coins held for less than 6 months) in realized cap, shown as the orange line, alongside its 30-day change (STH 30d Δ), shown as the blue line.
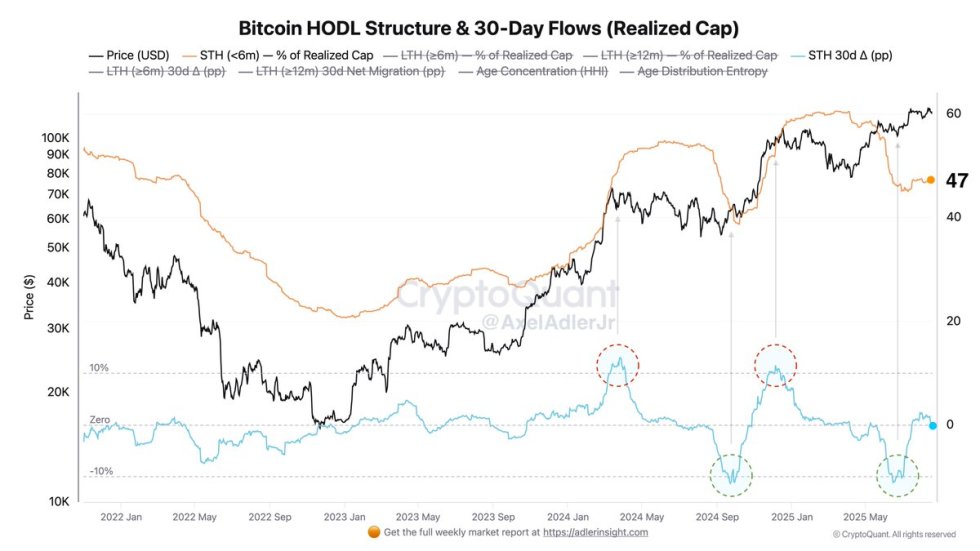
The blue curve highlights the net migration of value between younger and older coins. When the curve rises, it signals accelerating turnover and distribution from long-term holders (LTH) to STH, often marking overheated phases. Conversely, when the curve declines, it points to coin aging and the strengthening of “diamond hands,” typically observed during capitulation and recovery periods.
Currently, Bitcoin trades at all-time highs, with STH share at 47% and STH 30d Δ sitting at 0. This means there has been no notable FLOW between young and old cohorts over the past month. Adler explains that such conditions reflect an equilibrium regime, where neither new speculative demand nor heavy long-term distribution dominates.
Historically, spikes in the Δ above 10 percentage points (red markers) coincided with local tops and overheating phases, while DEEP drops below -10 (green markers) marked capitulation and rebound zones. With zero Δ at ATH, Adler suggests the base case scenario is consolidation, with neutral short-term pressure. This equilibrium hints that Bitcoin may stabilize at high levels before its next decisive move.
Price Action Details: Key Levels To Watch
Bitcoin’s 4-hour chart shows increased volatility following the rejection at the $123,217 resistance level. After testing this zone twice in August, BTC failed to sustain momentum, leading to a sharp reversal. The latest decline has pushed the price back toward $115,121, with the market now trading below key short-term moving averages.

The 50 SMA ($118,927) and 100 SMA ($116,982) acted as resistance during the retracement, while the 200 SMA ($117,514) was also breached, signaling weakening short-term momentum. The loss of these levels confirms sellers’ control, as BTC now trades below all major moving averages on this timeframe.
The consolidation between $114K and $118K highlights a critical decision zone. If BTC loses $114K decisively, downside targets could extend toward $110K–$112K, aligning with previous support levels and reinforcing a deeper correction scenario. On the flip side, reclaiming $118K WOULD be an important signal of renewed strength, potentially opening another test of the $123K resistance.
Featured image from Dall-E, chart from TradingView
