Bitcoin NUPL Signals Extended Bull Run: Is the Third Mega Peak Imminent?

Bitcoin's Net Unrealized Profit/Loss (NUPL) metric is flashing bullish signals again—suggesting this rally has legs. Traders are eyeing the potential formation of a third historic peak, but will Wall Street's usual suspects 'discover' crypto just in time to miss the real move?
The NUPL Bull Case
When NUPL stays above key thresholds, it typically means investors are holding through volatility—a classic hallmark of sustained uptrends. Current patterns eerily mirror past cycles where BTC defied skeptics to print new highs.
Peak Psychology
If this is indeed the third major NUPL peak, history says the euphoria phase could be explosive. Just don’t expect CNBC to notice until retail FOMO hits maximum overdrive.
One cynical truth? The same institutions that called crypto a scam in 2022 will probably launch 'blockchain ETFs' right as the smart money takes profits.
Bitcoin NUPL Data Points to Unique Cycle Structure
According to analyst Yonsei Dent, the Net Unrealized Profit/Loss (NUPL) metric remains one of the most telling on-chain indicators for assessing market sentiment and cycle positioning. NUPL measures the proportion of coins in profit versus loss.
Historically, market cycle tops have coincided with NUPL peaks. In the 2017 cycle, the metric formed a single major peak before a sharp reversal. In 2021, it produced two distinct peaks, each aligning with a wave of overheated price action and subsequent corrections.
In the current cycle, NUPL appears to be attempting a third peak, a behavior not seen in previous bull runs. Unlike past cycles characterized by sharp, singular blow-off tops, the present market is advancing in stepwise waves. Dent attributes this structural change largely to the influx of institutional capital, driven in part by the growth of US-based spot bitcoin ETFs.
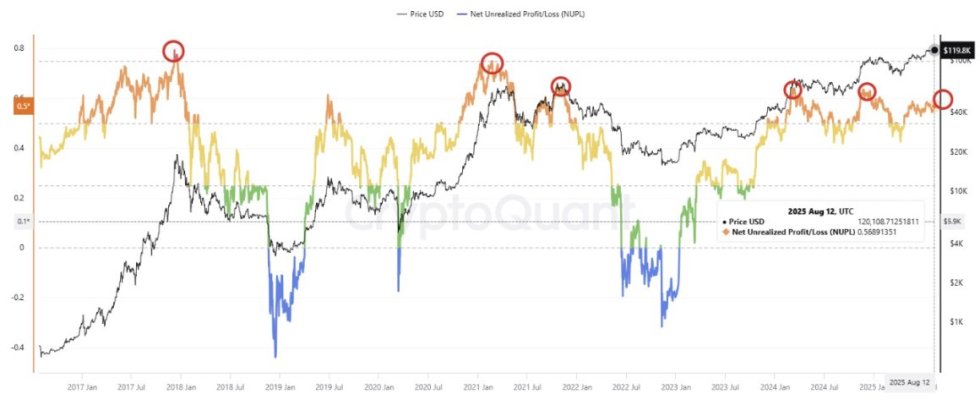
This institutional presence has increased the market’s size, liquidity, and stability, but has also moderated extreme percentage gains seen in prior rallies. While this environment could extend the duration of the bull market, it also suggests a reduced likelihood of short-lived, overheated surges.
In practical terms, this means the market may see longer, more sustained uptrends with shallower corrections, rather than the volatile boom-and-bust patterns of earlier cycles. Traders and investors watching NUPL closely will be looking for whether this potential third peak forms fully — and if it signals a more tempered, but prolonged, phase of Bitcoin’s growth.
Resistance Rejection At New All-Time High
On the 12-hour chart, Bitcoin (BTC) is trading at $121,596, down 1.37% after briefly touching $124,501 — a new all-time high. This MOVE marks another test of the $123,217 resistance level, which has acted as a ceiling for price action. The sharp rejection from above this zone suggests strong selling pressure at higher levels, at least in the short term.
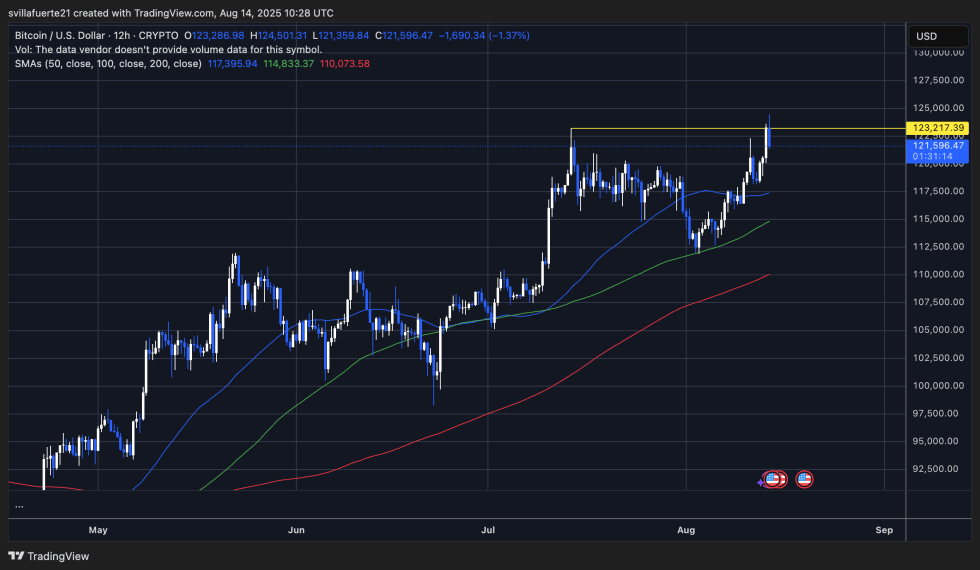
Despite the pullback, BTC remains in a clear bullish structure, holding well above its 50 SMA ($117,395), 100 SMA ($114,833), and 200 SMA ($110,073). These moving averages are rising, reflecting strong underlying momentum. The recent surge from early August lows NEAR $113,000 shows that bulls still control the medium-term trend.
The $123K–$124K area remains the critical breakout zone to watch. A confirmed close above $124K could open the door to further gains and trigger momentum buying, potentially leading to new price discovery. On the downside, immediate support lies near $120K, followed by stronger support at $117K, where the 50 SMA aligns with previous consolidation.
Featured image from Dall-E, chart from TradingView
