🚀 Ethereum Network Explodes: Active Addresses Hit 2-Year Peak as DeFi Summer 2.0 Brews

Ethereum's heartbeat just went tachycardic—the blockchain's active addresses are pumping at levels not seen since the last crypto bull run.
The Address Avalanche
Nearly two years after the great deleveraging of 2023, ETH wallets are waking up like bears after hibernation. On-chain metrics show retail and whales alike are moving—whether that's toward profits or another 'learning opportunity' remains to be seen.
Gas Fees: The Unwelcome Party Guest
With activity spiking, network fees are inevitably creeping up—because what's an Ethereum rally without users paying $50 to swap $20 of tokens? TradFi bankers would charge you half that for a wire transfer... and actually process it in under 45 minutes.
DeFi's Second Wind?
The surge coincides with renewed yield farming activity, suggesting degenerate gamblers—sorry, 'sophisticated liquidity providers'—are back at the roulette wheel. Smart money's betting this is more than just a dead cat bounce.
Ethereum's proving it's still the main stage for crypto's financial theater—whether that's a tragedy or comedy depends entirely on your entry price.
Ethereum Daily Active Addresses Near Highest Level In 2 Years
According to data from institutional DeFi solutions provider Sentora, the Ethereum blockchain has seen activity light up recently. The “Daily Active Addresses” is an on-chain indicator that keeps track of the total number of ETH addresses that are taking part in some kind of transfer activity every day.
When the value of this metric rises, it means a greater number of users are making moves on the network. Such a trend implies the trading interest in the cryptocurrency may be going up.
On the other hand, the indicator observing a drop suggests investor activity is going down on the blockchain. This kind of trend can be a potential sign that attention is shifting away from the asset.
Now, here is a chart that shows the trend in the Daily Active Addresses for Ethereum over the past year:
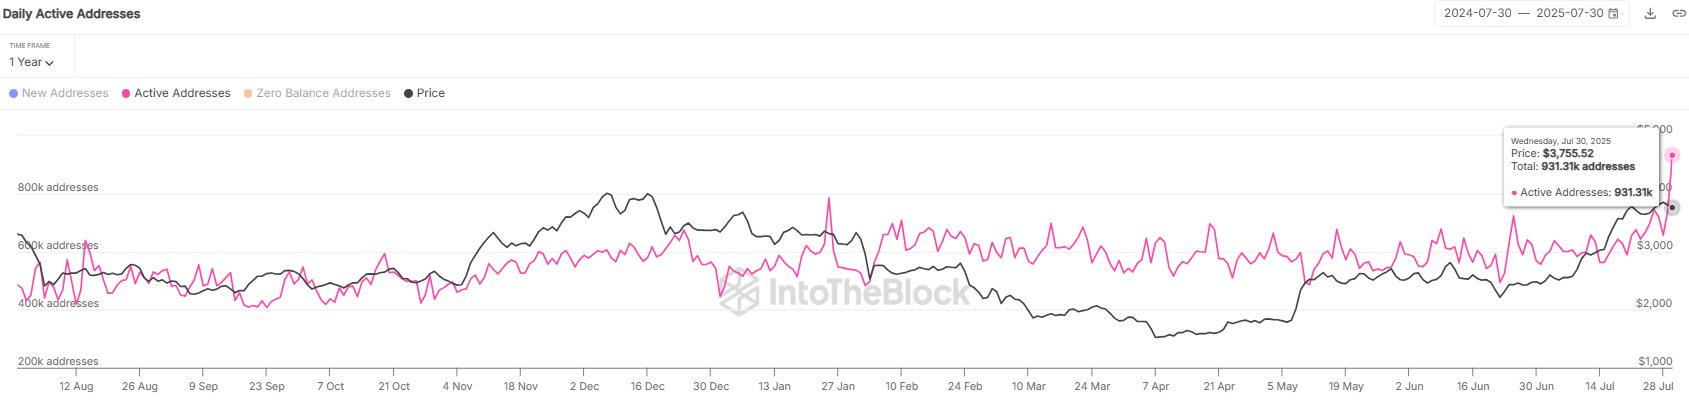
As displayed in the above graph, the Ethereum Daily Active Addresses saw deviation above its recent consolidation level of 600,000 with the latest rally, implying the price action brought interest in the asset.
Interestingly, the trend has accelerated in the last few days, with the indicator registering a sharp spike. This rapid increase has taken its value to 931,310, which is the highest daily level in almost two years.
Historically, high transaction activity from the users has often been a precursor to volatility. Any price action emerging out of the trading can, in theory, go either way, as the Daily Active Addresses contains no information about whether buying or selling is dominant, just that the investors are making moves.
It WOULD appear that the spike in the Ethereum Daily Active Addresses may have led into volatility this time as well, as the cryptocurrency’s price has plunged since it has appeared.
In some other news, stablecoin USDT has seen its 30-day moving average (MA) transfer volume recover to the $52.9 billion mark recently, as on-chain analytics firm Glassnode has explained in an X post.
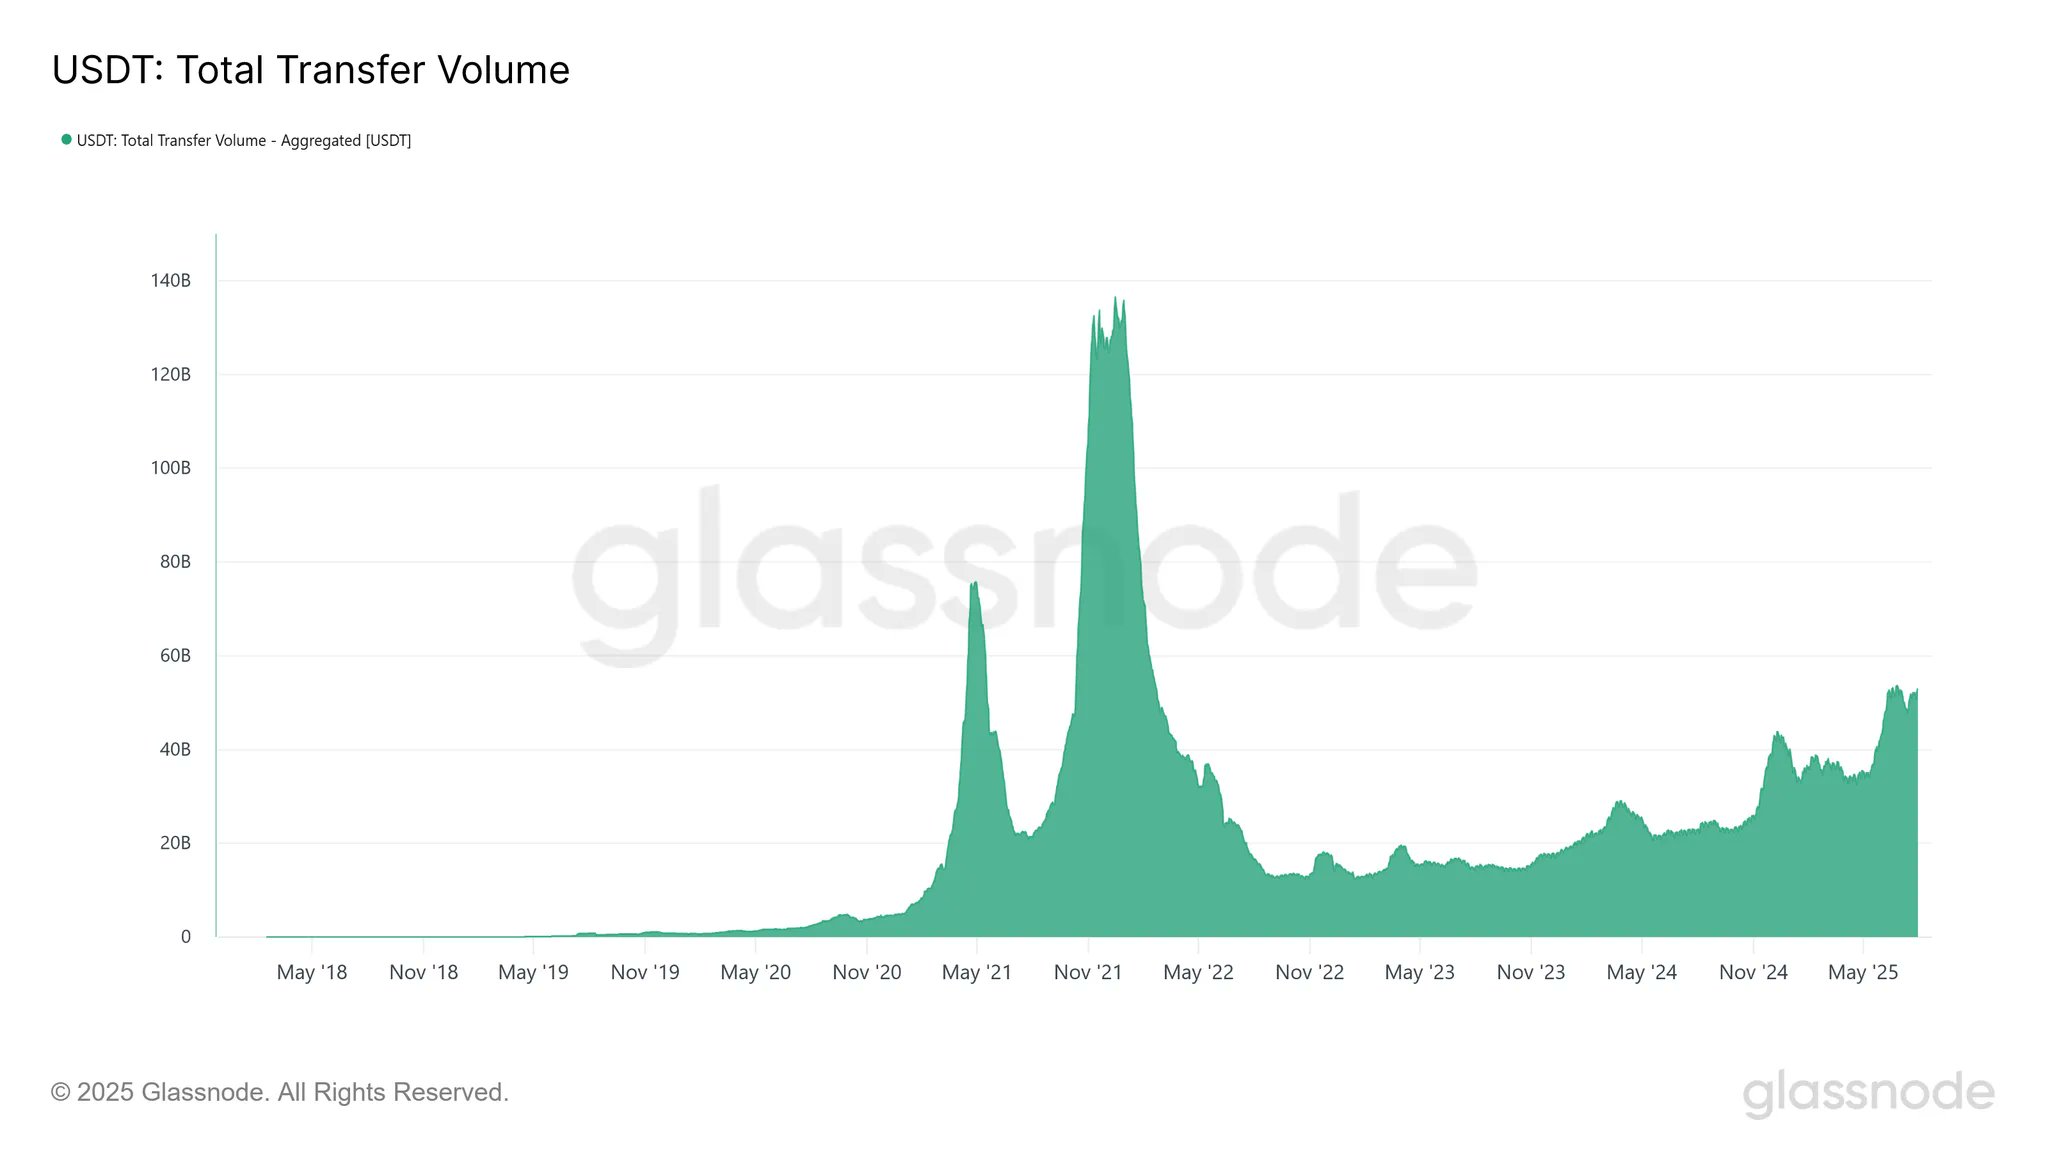
As displayed in the above graph, the USDT transfer volume has steadily been recovering since the 2022 crash. “This gradual climb reflects a slow but consistent recovery in stablecoin velocity and market activity,” notes Glassnode.
Interestingly, Ethereum has not even been among the top two networks that occupy the largest share of the stable’s volume.
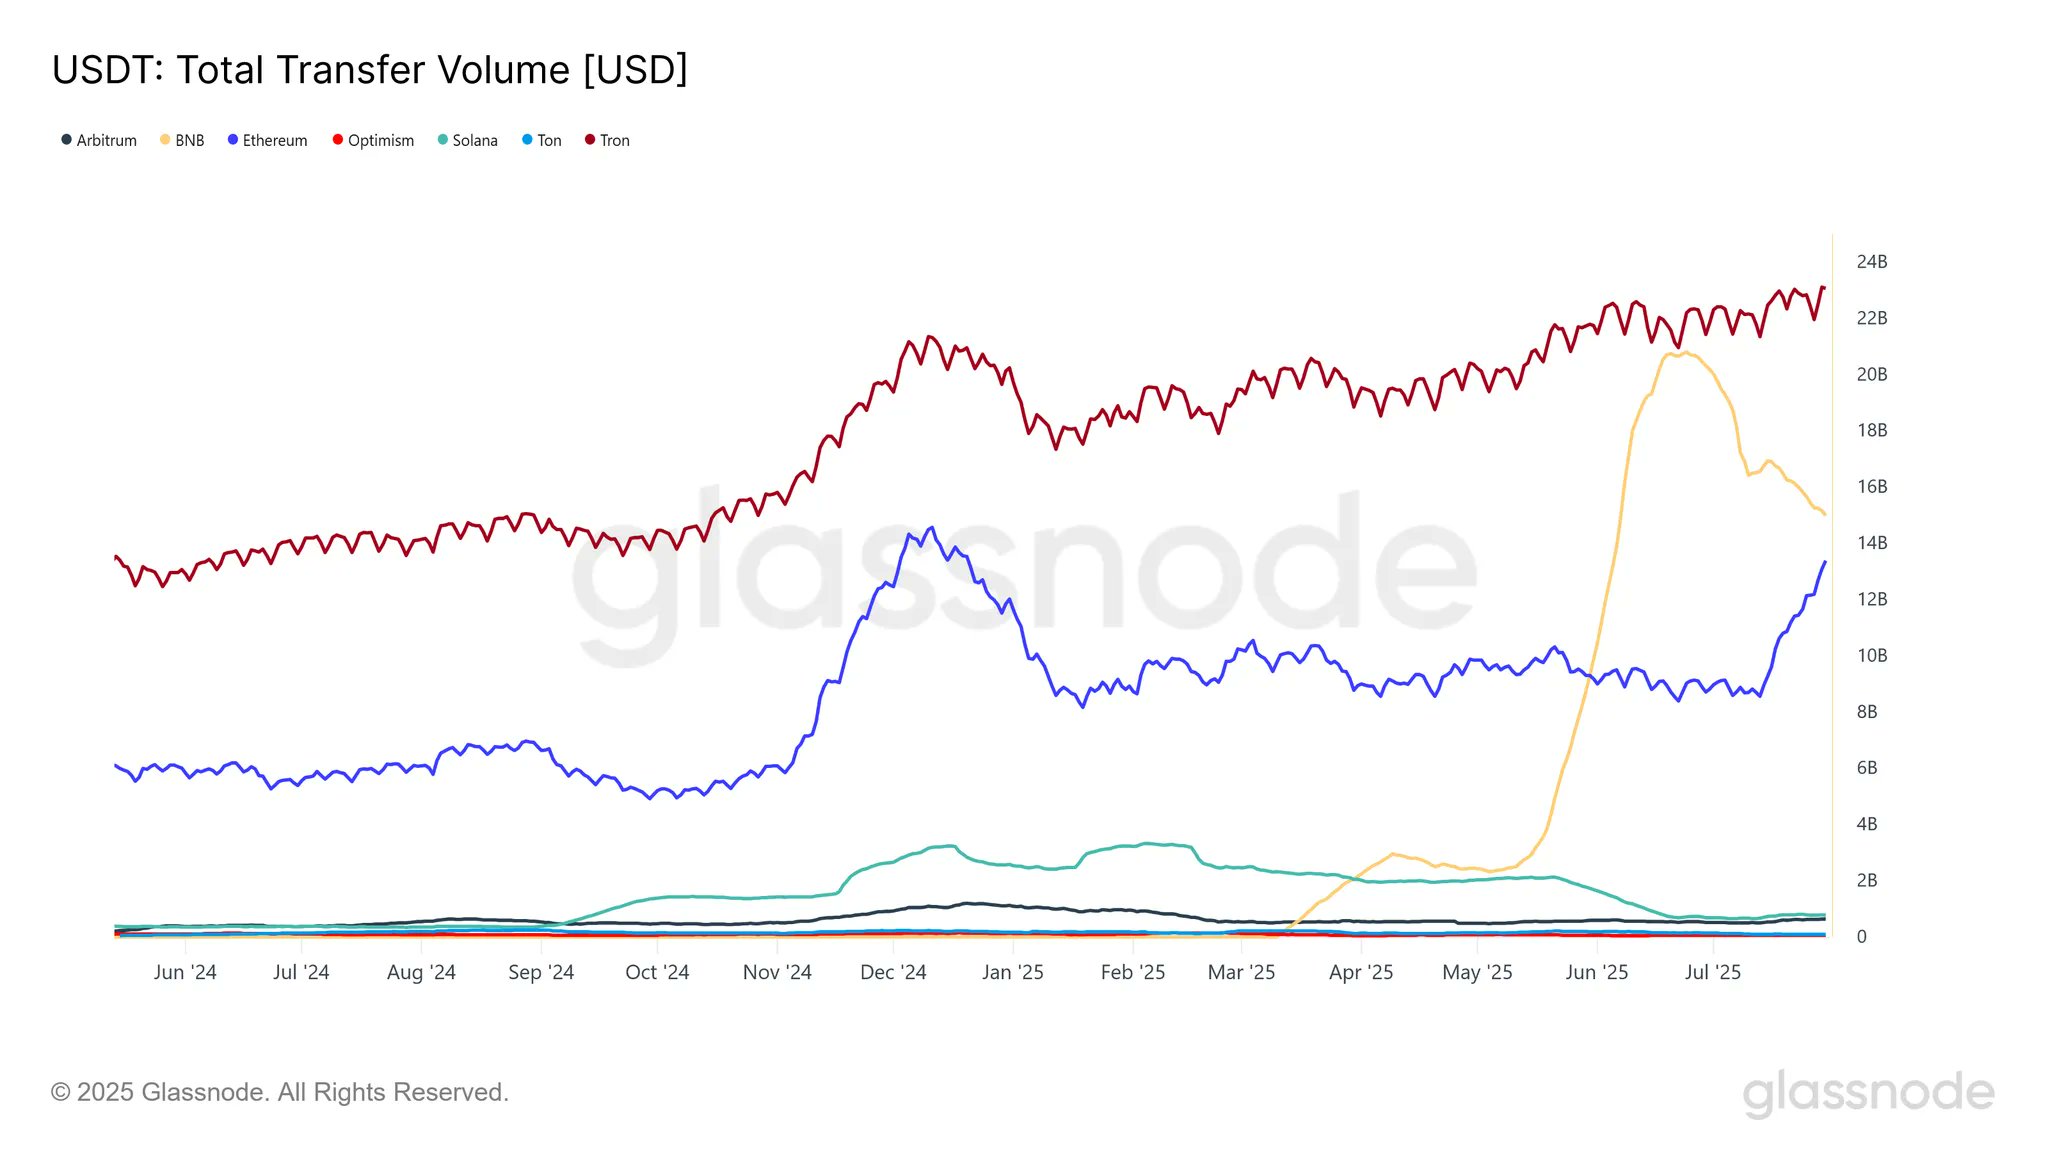
Tron and BNB are the two networks leading in USDT volume, with the metric sitting at $23 billion and $14.9 billion, respectively.
ETH Price
At the time of writing, Ethereum is trading around $3,650, down around 3.5% in the last 24 hours.
