XRP’s Elliott Wave Pattern Signals Imminent Wave 3 Surge — Will $3 Become the New Floor?

XRP's chart flashes a textbook Elliott Wave setup—and traders are bracing for liftoff.
The third wave, typically the most explosive phase of this pattern, could send the cryptocurrency soaring past previous resistance levels. But here's the million-dollar question: Can it sustain momentum above the psychological $3 barrier?
Technical analysts point to strong accumulation patterns while skeptics whisper about 'another fakeout'—because what's crypto without a little drama? Either way, the next few weeks could separate the diamond hands from the paper hands.
Remember: In crypto, TA is gospel until it's not. Just ask the 'experts' who called the last three 'bull runs' six months early.
Resistance Ahead: What’s Next If $3 Support Holds
In a recent X post, market analyst CasiTrades pointed out a potentially explosive setup forming as XRP tests the critical $3.00 support zone, which could define the next phase of the market cycle. Unfortunately, XRP was unable to sustain momentum at the $3.21 resistance level, causing it to retest the $3.00 support zone. This level has previously acted as a strong foundation during price consolidations.
Related Reading: xrp price Showing Quiet Strength As Next Breakout Level Lies At $4.65
Despite the recent pullback, the token has not made a new low, which is a positive sign that the broader structure remains intact. Instead, price action suggests that the market may have just completed a subwave 2 correction within a new emerging trend.
Notably, this retracement has reached a DEEP 0.854 Fibonacci level, where wave 2 often finds support before reversing. If this level continues to hold, the stage may now be set for a powerful subwave 3.
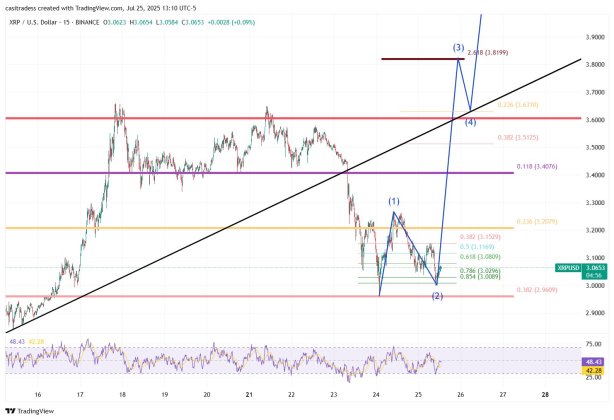
Furthermore, if buying volume begins to rise and XRP starts reclaiming ground above the $3.21 resistance, it could trigger a sharp MOVE higher. This setup suggests that once this level is cleared with conviction, bullish momentum may accelerate quickly and may potentially confirm the start of subwave 3. The initial target for this wave sits near $3.82, which aligns with the 2.618 Fibonacci extension.
What makes this level even more compelling is that $3.82 is the historical all-time high that many websites have cited, although the exact ATH remains debatable, which still gives more confidence in the plan. Many traders remain cautious following the recent selloff, while others appear to be distracted by the approaching weekend, which is a time for surprise.
Timing The Move: Is XRP Nearing Its Inflection Point?
An analyst known as Cryptobilbuwoo0 on X has stated that XRP is currently experiencing a correction that is strikingly similar to the long-term correction observed in December 2017 before the significant uptrend that followed.
Related Reading: XRP price Forms Double Top, This Structure Says A Crash Is Coming
This pattern shows that the altcoin is retracing deeply and consolidating near key support levels, much like it did during that pivotal period. XRP is poised to head toward the Fibonacci 1.618 extension level, mirroring the price action that occurred in April 2017.
In the meantime, the analyst is unsure that the altcoin will experience a similar long correction after the 1.236 Fibonacci level drop, as it did in 2017. Instead of an extended pause, XRP is likely to go through a brief, sharp, and sizable correction. From there, the 5th wave is expected to emerge swiftly in the blink of an eye.
