Bitcoin HODLers Show Diamond Hands as Short-Term Weakness Meets Unshakable Long-Term Belief

Bitcoin's HODL momentum takes a hit—but the smart money isn't flinching.
While weak hands panic-sell, long-term conviction quietly builds. The crypto king's latest dip? Just another buying opportunity for those who understand the game.
Funny how Wall Street still thinks 'volatility' is a dirty word while Bitcoiners laugh all the way to the (decentralized) bank.
Bulls Eye Breakout As HODL Momentum Strengthens
After reaching a new all-time high just above $112,000, Bitcoin is now consolidating beneath this key resistance level. Bulls are clearly in control, but the market is awaiting a clean, sustained breakout above $112K to confirm the next leg of the rally. So far, BTC has maintained strength above prior support zones and continues to trade in a tight range, hinting that a decisive move is imminent.
Macroeconomic developments remain supportive of risk assets. The U.S. Congress passed President Donald Trump’s highly anticipated “big, beautiful” bill just before the July 4 deadline. This legislation includes substantial tax cuts and aggressive spending measures, which are expected to drive inflationary pressure, conditions that historically benefit Bitcoin. Additionally, strong labor market data in the US has improved investor sentiment, helping to anchor bullish expectations.
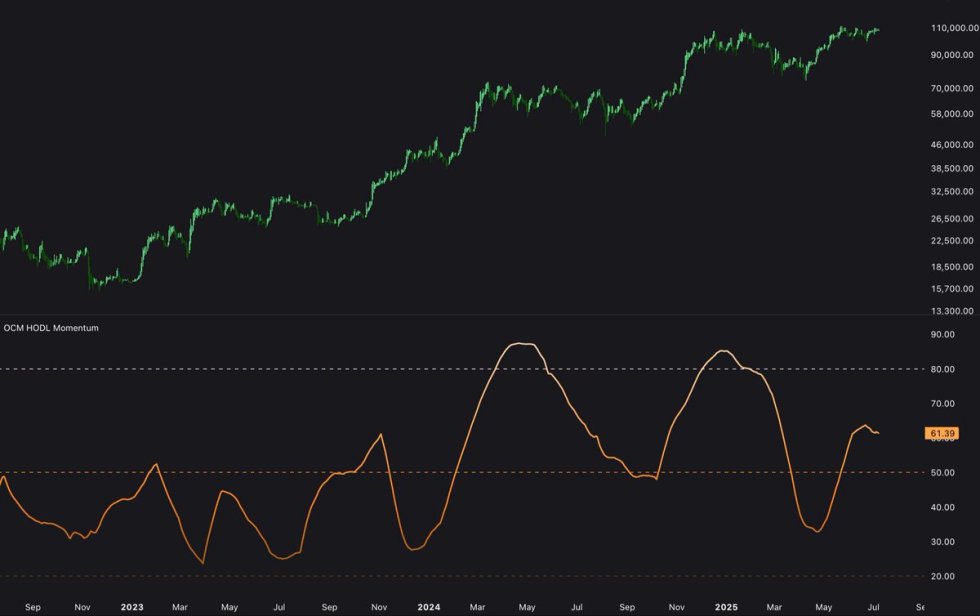
Adding to the positive outlook, on-chain data offers compelling evidence of long-term confidence. On-Chain Mind points out that HODL Momentum is now trending downward. This indicator measures the relative strength of bitcoin holders who have kept their coins unmoved for more than one year. A decline in this metric suggests that long-term holders are not distributing into the rally, an encouraging sign for bulls.
This behavior implies strong conviction and a willingness to hold through volatility, rather than locking in gains prematurely. Historically, when long-term holders choose to stay put while prices climb, Bitcoin tends to experience powerful upward extensions. As the market digests macro shifts and psychological resistance, all eyes remain on the $112K level for confirmation. If broken cleanly, it could mark the beginning of a fresh surge into uncharted territory.
BTC Price Analysis: Holding the Breakout Zone
Bitcoin is trading at $111,079 on the 12-hour chart after briefly pushing above the $112,000 mark, marking a new all-time high before slightly retracing. Despite the pullback, BTC is still holding well above the previous resistance level at $109,300, which is now acting as support. This structure confirms a breakout attempt, and bulls are now tasked with maintaining momentum for further upside.

The chart shows increasing volume during the breakout, indicating strong market participation. The price also remains above the 50-, 100-, and 200-period moving averages, all of which are sloping upward, suggesting bullish continuation. As long as Bitcoin continues to close candles above the $109,300 support, the breakout remains valid.
The 12-hour structure also highlights a higher-low pattern dating back to late June, adding strength to the bullish setup. A successful defense of current levels could pave the way for a clean retest of $112,000, and potentially send BTC into price discovery territory.
However, failure to hold the breakout zone could result in a drop toward $106,800 or even $103,600, where previous support and moving average confluence sit. For now, the market is watching closely for confirmation of this breakout as bulls attempt to maintain control.
Featured image from Dall-E, chart from TradingView
