Bitcoin Volatility Craters to Bull Cycle Lows – Bollinger Bands Scream Imminent Explosion

Bitcoin's price action just flatlined to its tightest squeeze since the bull run began—and the Bollinger Bands are flashing a neon buy signal.
The calm before the storm? Historical precedent suggests these volatility contractions precede violent upside moves. When the bands pinch this tight, the market typically erupts like a coiled spring.
Traders eyeing the $100K psychological barrier are loading up on cheap options—Wall Street's latest 'hedge' against their own FOMO. Meanwhile, retail investors keep chasing meme coins while the real asymmetric bet stares them in the face.
Will this be the breakout that finally shatters institutional skepticism? Or just another fakeout to liquidate overleveraged degens? Place your bets—the algos are already locked and loaded.
Bitcoin Consolidates As Bollinger Bands Squeeze Signals Next Move
Bitcoin continues to consolidate just below its all-time high of $112,000, frustrating bulls and bears alike. Despite ongoing resistance at the top, bears have failed to drive the price below $105,000, confirming strong demand at key support levels. As the price tightens, the broader macroeconomic picture adds complexity to the outlook.
The US Congress recently passed President Donald Trump’s “big, beautiful” economic bill just before the July 4 deadline. The package includes tax cuts and aggressive public spending, which are expected to fuel inflation in the coming quarters. Coupled with optimistic job data, these developments are shaping investor sentiment across traditional and crypto markets.
On the technical side, Axel Adler highlighted a classic Bollinger Bands squeeze currently forming on Bitcoin’s chart. The range between the upper and lower bands has compressed to just 7.7%—one of the tightest readings seen throughout the ongoing bull cycle. This kind of volatility drop suggests energy accumulation, with the price preparing for a significant move.
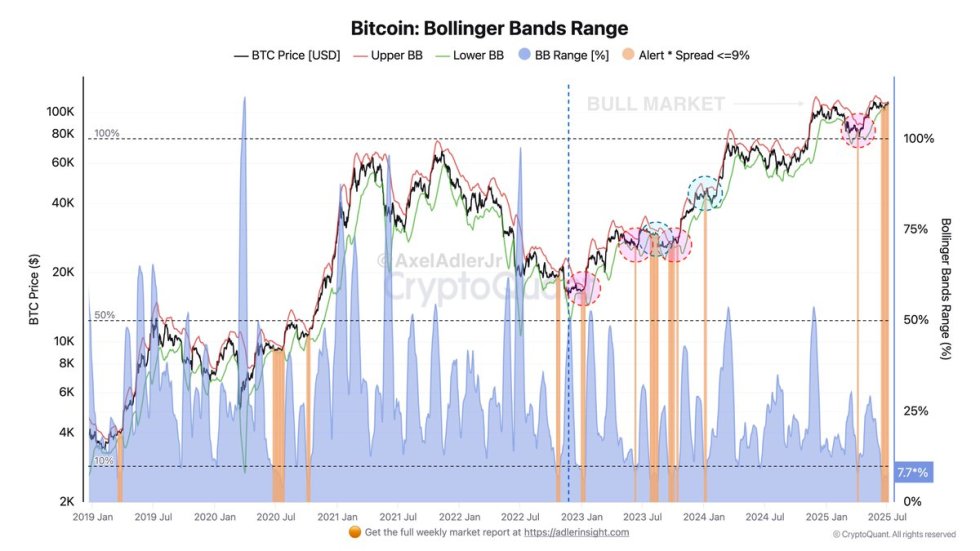
Historical patterns offer insight: of six major Bollinger Band squeezes this cycle, four resulted in immediate upside moves, and two triggered brief corrections before rallies resumed. With this precedent, Adler believes the current setup most likely foreshadows a bullish breakout, although minor consolidation beforehand is still possible.
BTC Price Holds Above Key Moving Averages
The 12-hour Bitcoin chart shows BTC trading at $108,892, struggling to break above the key resistance zone around $109,300. This level has acted as a rejection point multiple times since early June, confirming its strength. Despite the recent pullback, price remains above the 50 SMA ($106,442) and 100 SMA ($106,671), indicating bullish momentum is still in play.

Importantly, bulls have defended the $106,000–$107,000 support range several times, preventing deeper corrections and keeping BTC within a tight consolidation range. Volume has declined in recent sessions, suggesting the market is waiting for a catalyst to break out of this range. If Bitcoin closes decisively above $109,300 on strong volume, a run toward the $112,000 all-time high becomes increasingly likely.
On the downside, a break below the 100 SMA could expose BTC to the next major support around $103,600, a key level that has held since mid-May. The 200 SMA (currently at $99,093) remains a long-term support zone that hasn’t been tested in months.
Featured image from Dall-E, chart from TradingView
