Bitcoin Outflow Ratio Echoes 2023 Accumulation Phase – Is a Mega Rally Brewing?

Bitcoin's latest outflow metrics are flashing a familiar signal—one that last appeared during the 2023 accumulation frenzy. Could this be the set-up for another parabolic move?
When whales start parking coins off exchanges, history suggests they're playing the long game. The current outflow ratio mirrors patterns seen before Bitcoin's 60% surge in early 2024.
Market veterans are whispering about deja vu. 'This looks like institutional accumulation 2.0,' says one OTC desk trader, 'except now the Wall Streeters are using crypto-native tools instead of begging Goldman for exposure.'
The real tell? Exchange reserves just hit a 14-month low while derivatives open interest keeps climbing—a classic bullish divergence. Meanwhile, retail traders remain distracted by the latest memecoin du jour (because nothing says 'sound investment' like a dog-themed token with 12% APY).
Will history rhyme? The charts say maybe. The fundamentals scream probably. And the hedge funds? They'll take credit either way.
Bitcoin Range-Bound As Long-Term Confidence Builds
Bitcoin is currently trading within a tight range between $103,000 and $110,000. This range has persisted for several weeks, creating a buildup in momentum that suggests a breakout is imminent. A decisive move above $110K could push bitcoin into price discovery, while a breakdown below $103K would likely trigger an accelerated downside. For now, the market remains in wait-and-see mode.
Macroeconomic uncertainty is beginning to ease, with more clarity emerging around interest rate policy and global growth expectations. Many analysts believe that a new bullish phase could unfold in the coming months. Still, risks remain. US Treasury yields are climbing once again, and inflation continues to show signs of persistence—two variables that could dampen market sentiment if they worsen.
Despite these headwinds, long-term investor confidence appears strong. Darkfost notes that outflows are once again dominating the market. The monthly outflow/inflow ratio has fallen to 0.9, a level not seen since the depths of the 2023 bear market. A ratio below 1 typically signals sustained demand on the spot market, as coins are being withdrawn from exchanges rather than prepared for sale.
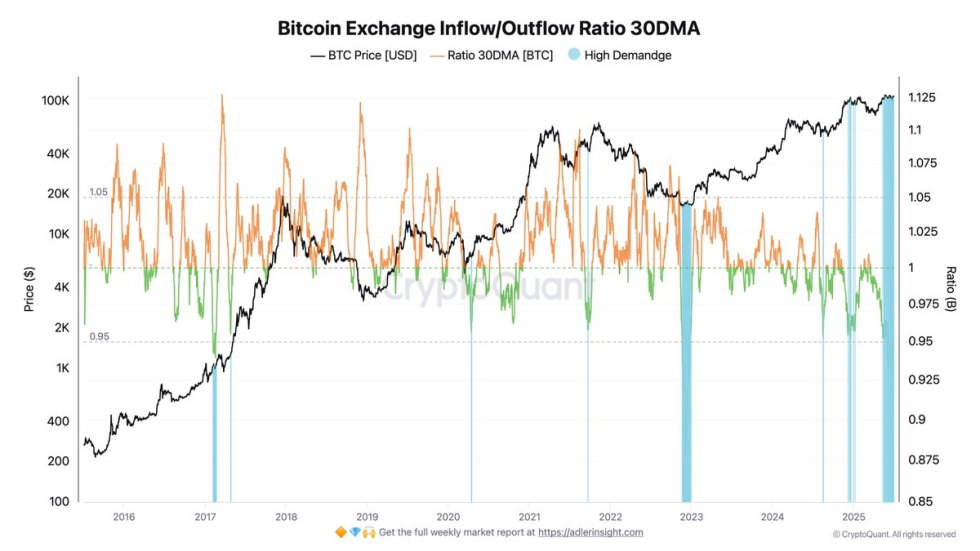
This behavior reflects growing conviction among long-term holders. Bitcoin is increasingly being embraced by corporations and even governments as a strategic reserve asset. It is gradually evolving into a modern-day store of value, used to bolster treasury allocations and reduce exposure to fiat currency risks.
As outflows continue and adoption grows, Bitcoin’s long-term fundamentals remain intact. The current range may only be a pause before the next major move—one that could define the trajectory of the market heading into Q3 and beyond.
BTC Consolidates Below Resistance
The 3-day Bitcoin chart shows continued consolidation just below the $109,300 resistance level, with support holding firm NEAR $103,600. This range has defined recent price action, and the low volatility hints at an impending breakout. Notably, BTC remains well above its key moving averages—the 50 SMA at $95,655, the 100 SMA at $90,529, and the 200 SMA at $73,817—suggesting the bullish trend remains intact on the higher timeframe.
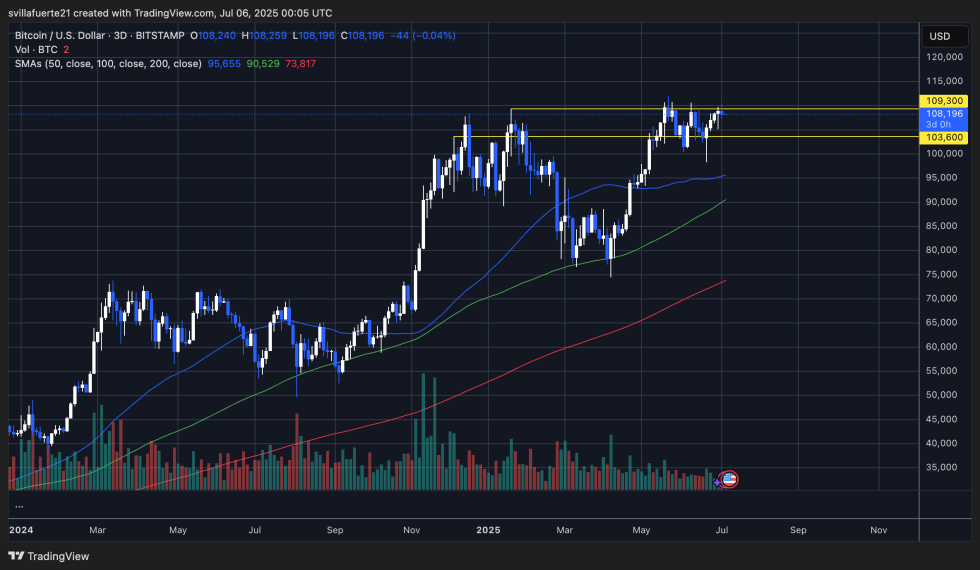
Despite repeated tests, buyers have yet to break above $109,300 with conviction. However, the series of higher lows since mid-April indicates consistent bullish pressure building beneath resistance. A breakout above the $112K all-time high WOULD mark a major technical shift and push BTC into price discovery, with upside momentum likely accelerating rapidly.
Volume remains relatively low, indicating market participants are waiting for a catalyst to confirm direction. Until then, traders are likely watching for another retest of the lower boundary of the range or a decisive move above resistance. As long as BTC maintains its current structure and key support holds, bulls remain in control. A close above the resistance zone would set the stage for the next leg up in this bullish cycle.
Featured image from Dall-E, chart from TradingView
