Bitcoin’s Derivatives Revolution: Futures Volume Skyrockets to $650 Trillion in New Market Era

Wall Street's favorite casino just got bigger—and Bitcoin's playing dealer.
The derivatives market has officially swallowed crypto whole as BTC futures volume hits a staggering $650 trillion. Forget 'digital gold'—this is digital oil, and the speculators are fracking at warp speed.
Why Traders Are All-In
Leverage junkies and institutional whales are driving the action, turning Bitcoin into the ultimate high-stakes poker game. No coins? No problem. You can now bet the farm without ever touching actual BTC—just how finance bros like it.
The Liquidity Mirage
That eye-popping number masks the real story: paper Bitcoin now dwarfs the underlying asset. Traders are building castles on sand, but hey—when the tide's rising, who cares about foundations?
One thing's clear: Bitcoin's grown up. Whether that's a coming-of-age story or a prelude to a Greek tragedy depends on who's holding the leverage. Place your bets—the house always wins.
Bitcoin Approaches Price Discovery As Futures Volume Surges
Bitcoin is on the verge of entering price discovery as bulls maintain control above the key $107,000 support. After a volatile consolidation phase, the market is heating up again with macroeconomic uncertainty fading. bitcoin has gained 47% since its April lows and now trades less than 2% below its all-time high of $112,000. The coming days are expected to be decisive, as a confirmed breakout above this level would signal a fresh bullish expansion, while a drop below key support could trigger short-term downside.
Top analyst Darkfost shared striking data revealing how the structure of the Bitcoin market has evolved. Since the launch of BTC futures on Binance in September 2019, the platform has accumulated more than $650 trillion in cumulative futures volume for Bitcoin alone. In comparison, spot volume during the same period reached $168 trillion, four times lower.

This disparity marks a paradigm shift in market behavior. While spot volumes typically reflect long-term investor conviction, the rising dominance of futures trading illustrates the growing influence of speculative and Leveraged activity in shaping price action.
During this cycle, daily BTC futures volume on Binance has exceeded $75 billion on multiple occasions—an unprecedented threshold since the exchange first introduced BTC futures. As Bitcoin approaches a new potential high, the interaction between futures-driven momentum and broader market sentiment will play a pivotal role in determining the sustainability of the next move. Whether it’s a push into uncharted territory or another round of consolidation, the structure of today’s market makes clear that derivatives are now leading the charge.
BTC Price Analysis: $109K Resistance Remains The Key Hurdle
Bitcoin (BTC) continues to consolidate just below its all-time high, with the 12-hour chart showing a clear rejection from the $109,300 resistance zone. Price action remains compressed between $109K and the $106,000–$106,300 support cluster, which aligns with the 50 and 100 simple moving averages (SMAs). This structure suggests the market is in a state of preparation for a larger move.
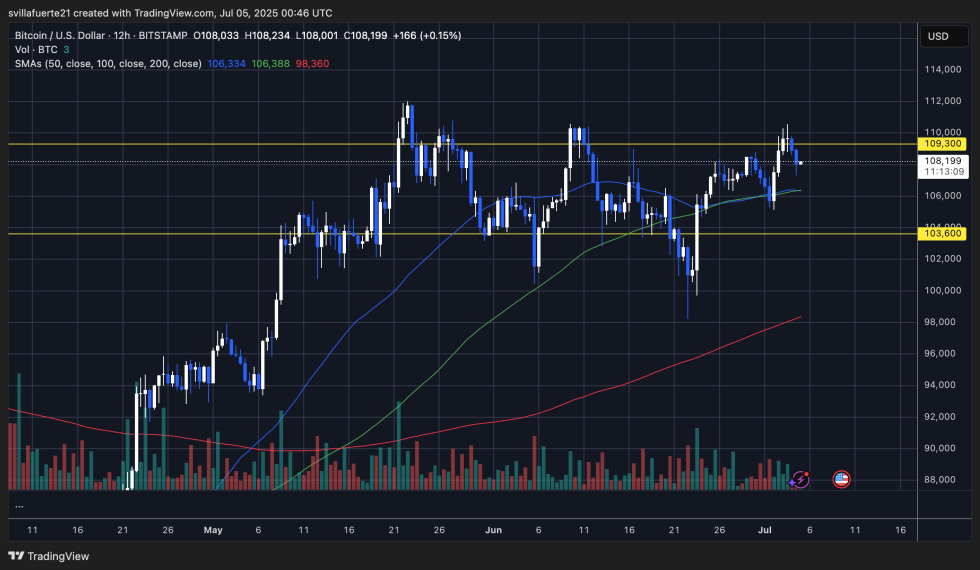
Volume has decreased slightly, reflecting market indecision, while price remains above the 200 SMA—a bullish sign for the medium-term trend. Bitcoin’s higher low structure since mid-June remains intact, supporting a bullish bias as long as the $106K area holds. A decisive breakout above $109,300 could trigger a rally toward price discovery above the $112K all-time high, but until then, the sideways movement signals caution.
A breakdown below the $106K support could open the path to retesting $103,600, the last major demand zone. However, bulls continue to defend key moving averages, reinforcing current momentum. As the market awaits confirmation, traders are watching volume spikes and structural breaks for the next leg. With macro conditions improving and sentiment leaning bullish, Bitcoin’s next MOVE could define July’s trend.
Featured image from Dall-E, chart from TradingView
