Bitcoin’s Ominous Signal: Brace for a Plunge Below $40K, Warns Top Analyst

Bitcoin's flashing a red alert—one that historically precedes brutal corrections. Here's why traders are sweating.
### The Drop Zone: $40K or Bust
A rare technical pattern—last seen before the 2022 carnage—just triggered. When this signal hits, markets tend to bleed. Fast.
### Liquidity Hunters Circle
Whales love nothing more than shaking out weak hands before the next rally. Cue the 'market health' concern trolls.
### Wall Street's Cynical Playbook
Meanwhile, institutional traders are already drafting 'I told you so' thinkpieces—while quietly stacking sats at discount prices.
Bitcoin Flashes Rare Bearish Signal
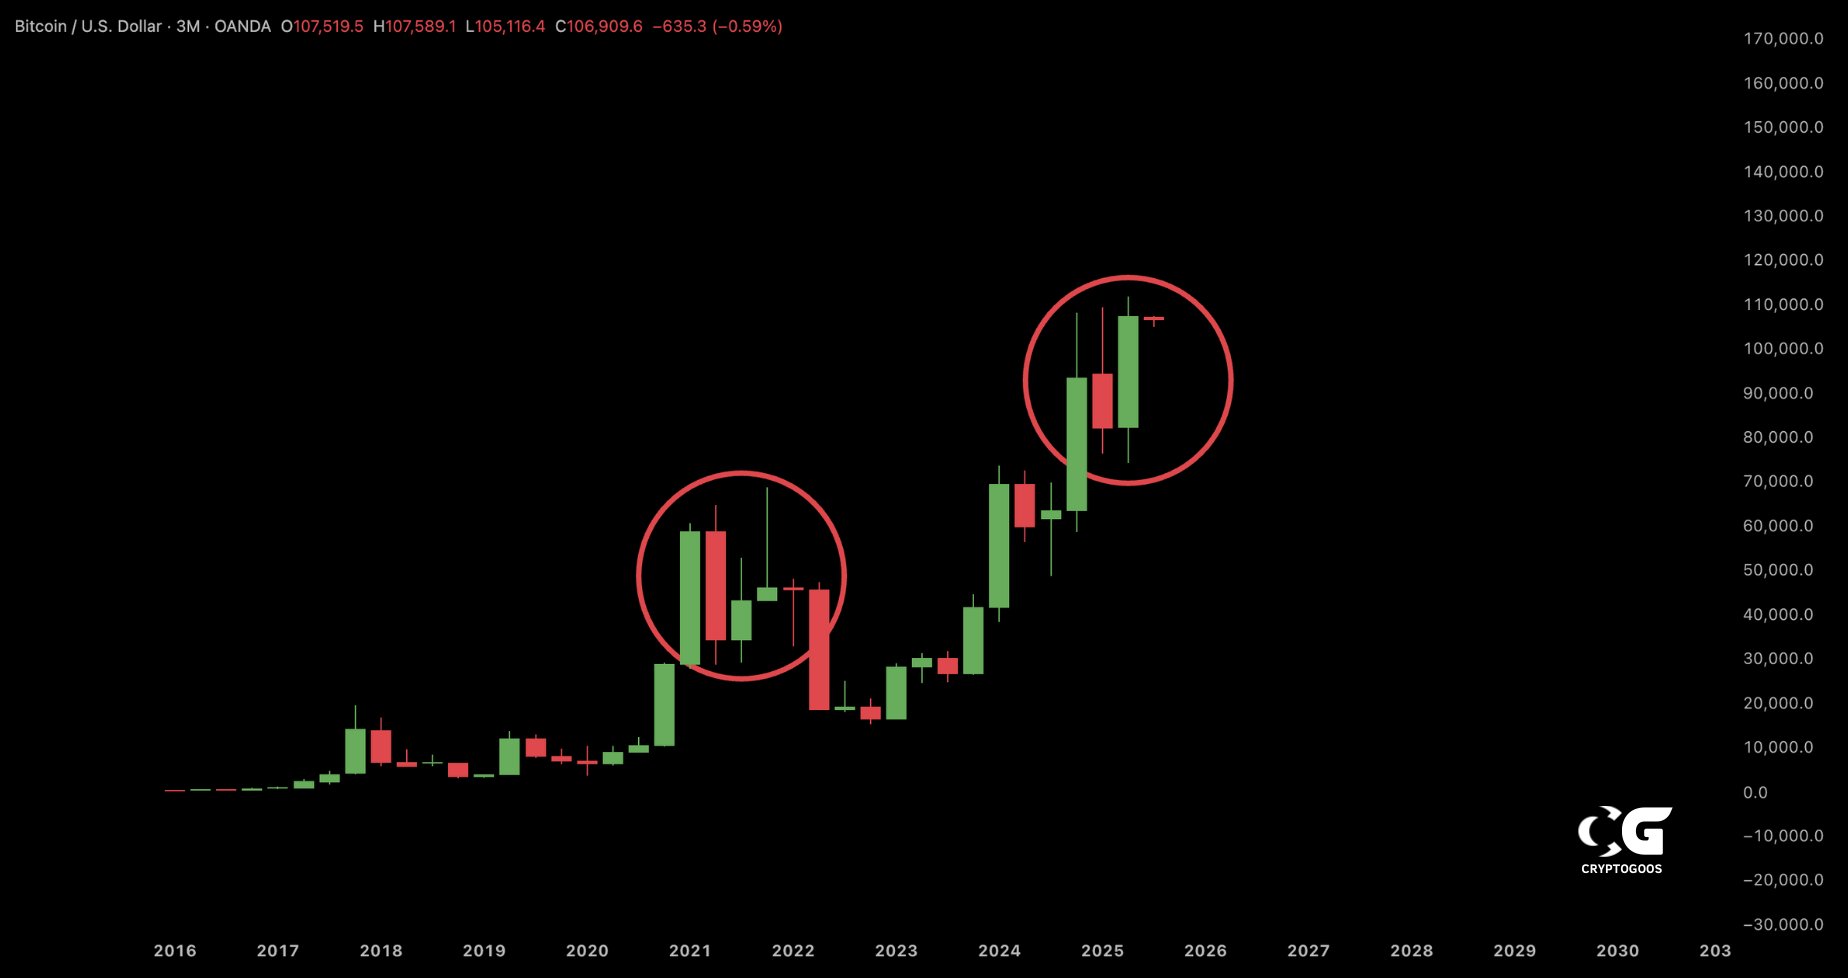
According to a recent X post by seasoned crypto analyst Ali Martinez, Bitcoin has triggered a Tom Demark (TD) Sequential sell-signal on the quarterly chart. Martinez noted that this is a rare and historically reliable warning that has often preceded major drawdowns for the cryptocurrency.
For the uninitiated, a quarterly TD Sequential sell-signal is a rare technical indicator that appears after multiple consecutive bullish quarterly candles, signaling long-term trend exhaustion. It suggests that bitcoin may face a significant correction after a prolonged uptrend.
In 2015, its appearance was followed by a 75% decline in BTC, while in 2018, a similar signal preceded an 85% crash. Martinez cautioned that if the current signal plays out similarly, Bitcoin could fall as low as $40,000 – a potential 64% drop from current levels.
However, not all analysts share this bearish outlook. Fellow crypto analyst CryptoGoos interpreted Bitcoin’s quarterly close as bullish. He disputed comparisons with the 2021 double-top pattern and suggested that market structure remains strong.
BTC Looking Ready For New High?
Despite the bearish TD Sequential sell-signal, several analysts remain confident that a new all-time high (ATH) is on the horizon. Analyst Jelle pointed out that BTC has broken out and successfully re-tested a 3-day bullish pennant, making it look “ripe for liftoff.”

In another post, Jelle noted that if BTC decisively breaks above $110,000, its next target could be $130,000. For reference, BTC’s current ATH is $111,814, recorded on May 22.
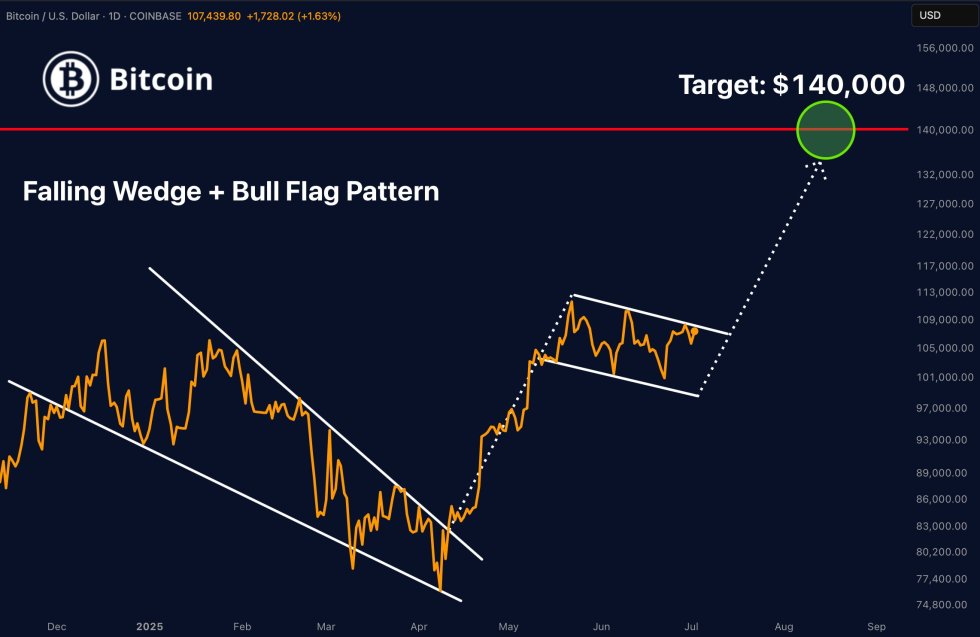
Meanwhile, Merlijn The Trader highlighted a bullish technical setup on BTC’s daily chart. He pointed to a breakout from a falling wedge, followed by the formation of a bull flag – two strong continuation patterns. He stated:
Two of the strongest continuation patterns back to back. $140K is not hopium. It’s the projection. Strong hands are positioning now. Bitcoin doesn’t wait. The breakout is inevitable.
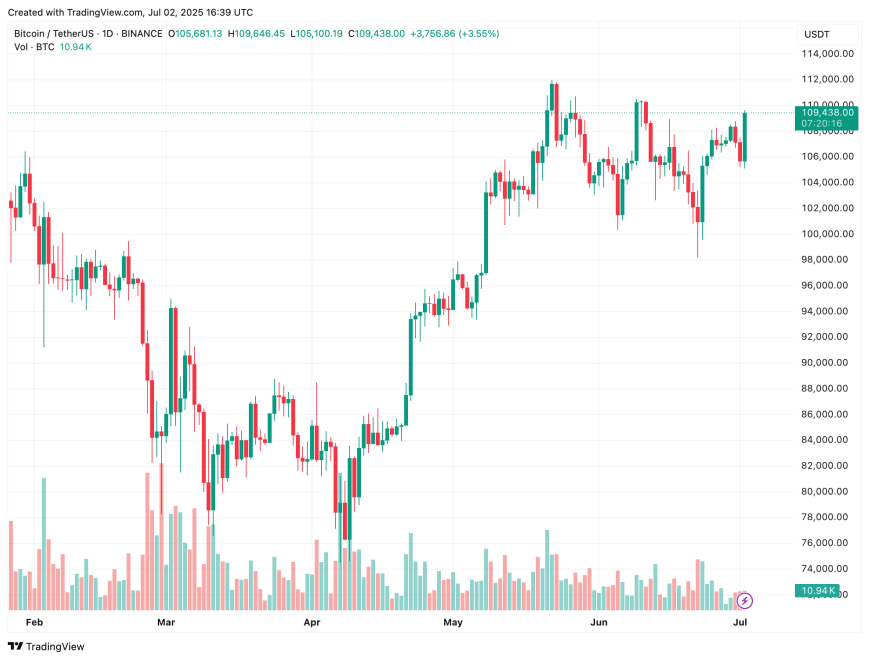
Additionally, Bitcoin’s weekly RSI continues to MOVE toward the upper trendline – a pattern that has historically coincided with BTC reaching new highs. At press time, BTC trades at $109,438, up 2.9% in the past 24 hours.