Bitcoin’s 30D Active Supply Plummets 17% – Mirroring Pre-Rally Signals Before Late 2024’s Epic Surge

Bitcoin's network just flashed a familiar signal—one that historically screams 'accumulation phase.' The 30-day active supply cratered 17%, matching the same on-chain behavior that preceded late 2024's parabolic rally.
The HODL Signal Returns
Coins aren't moving. Wallets are battening down. This supply freeze mirrors the exact conditions that kicked off last cycle's 3x price explosion—back when Wall Street analysts were still calling Bitcoin 'a speculative asset.'
Market Psychology at Play
When long-term holders stop spending, it's not capitulation—it's conviction. The last time this metric dipped so hard, retail FOMO hadn't even hit yet. Cue the institutional 're-evaluations' and suddenly everyone's a crypto believer.
One cynical footnote? The same traders who dismissed the 2024 rally are now repositioning their 'hedges'—just in time to chase the next leg up. Some things never change.
Bitcoin On the Edge of Expansion As On-Chain Metrics Flash Opportunity
The crypto market is heating up alongside US equities, which recently surged to new all-time highs. As macroeconomic uncertainty fades and risk appetite returns, Bitcoin sits at a pivotal moment. Bulls remain in control after a 45% rally from April’s $75K low, but to confirm the next leg up, BTC must decisively break into price discovery above the $112K resistance level.
A key on-chain metric suggests that conditions are aligning for such a move. Axel Adler explains that the “% Supply Active, 30D Change” tracks the percentage growth or decline in Bitcoin’s active supply over the past month. It measures how much of the supply has moved in the last six months and compares it to the same figure 30 days ago. When this value is positive, coin movement is accelerating—typically seen during high-volatility uptrends. When it’s negative, activity is slowing down, signaling accumulation or hesitation.
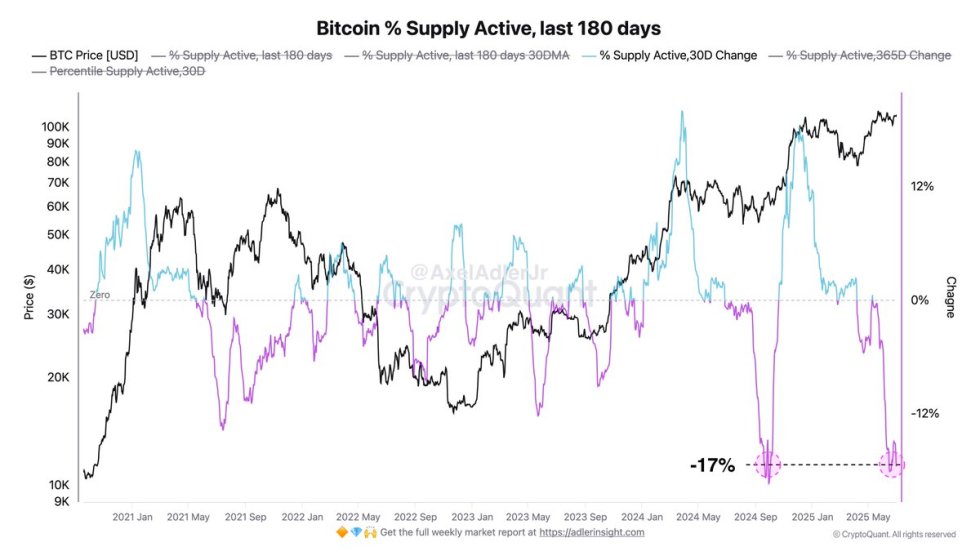
Currently, this value stands at -17%, indicating a marked drop in activity. That may seem bearish on the surface, but it mirrors the conditions seen in September 2024, just before a major rally began. The logic is simple: when fewer coins MOVE and supply becomes more static, a tightening effect builds. Once demand returns, it often leads to sharp upward moves.
In short, the low activity hints at a potential breakout window. Bitcoin is consolidating just below its all-time high, supported by favorable macro conditions and low on-chain velocity. If history is any guide, a sudden surge in activity—triggered by a move into new highs—could mark the beginning of the next expansion phase. All eyes are now on BTC’s next move.
BTC Weekly Chart Analysis: Bullish Momentum Builds Below All-Time Highs
Bitcoin’s weekly chart shows continued strength as price action consolidates just below the $112,000 all-time high. At the time of writing, BTC trades near $107,795, comfortably above the critical support zone at $103,600 and showing consistent higher lows since April. The 50-week moving average is rising sharply and now sits at $85,961, well below the current range, reinforcing the medium-term uptrend.
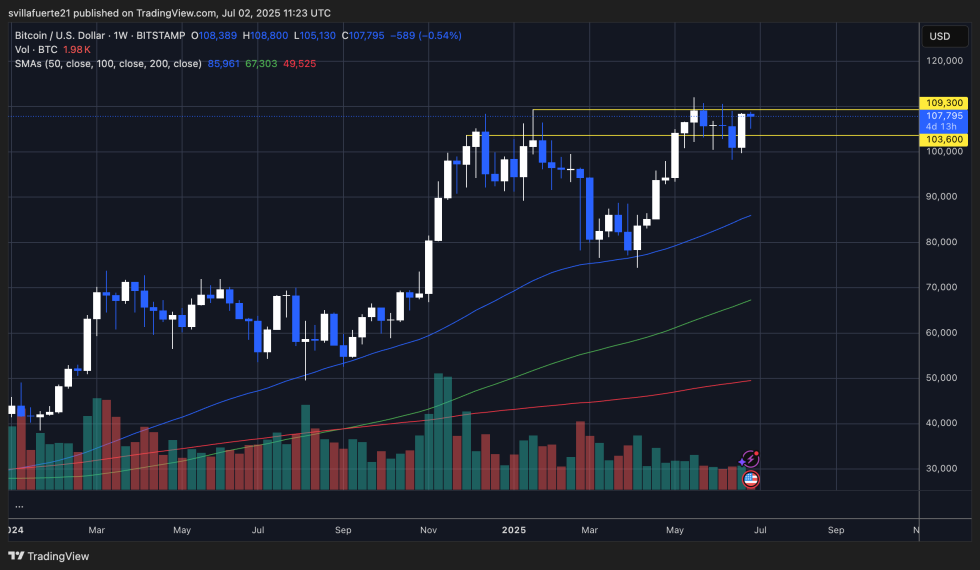
Despite recent rejections near the $109,300 resistance, bulls have defended weekly closes above $100K and maintained momentum within a tight bullish flag structure. Volume has tapered off slightly, suggesting that traders are waiting for confirmation before committing to large positions. However, the lack of aggressive selling pressure indicates that market participants expect a breakout rather than a breakdown.
If BTC breaks and closes above $109,300 on the weekly timeframe, the move WOULD likely trigger stop orders and momentum-driven buying, pushing the price into uncharted territory. A failure to break resistance could result in another retest of the $103,600 level, which has acted as a strong floor throughout Q2 2025.
Featured image from Dall-E, chart from TradingView
