Bitcoin’s Realized Supply Ratio Hits Equilibrium – Mirroring Pre-Bull Run Conditions Seen Before Late 2024’s Mega Rally

Bitcoin’s supply dynamics are flashing a familiar signal—one that historically precedes explosive price action.
The calm before the storm?
The Realized Supply Ratio—a metric tracking long-term holder behavior—has settled into equilibrium levels eerily similar to those seen in late 2024, just before BTC staged its last parabolic advance. No crystal ball needed: on-chain patterns suggest accumulation is underway while Wall Street still debates ‘digital gold’ fundamentals.
Why this time isn’t different (until it is)
Market cycles rhyme until they don’t. The same ratio signaled equilibrium before 2024’s 300% climb, but today’s macro landscape brings new variables: ETF flows, regulatory theater, and the eternal promise of institutional adoption—always just six months away.
The cynical take
While traders watch charts, remember: the real money’s in selling shovels during gold rushes. Coinbase’s Q2 earnings likely say more about market cycles than any technical indicator ever could.
Bitcoin Metrics Signal Market Neutrality
Bitcoin has been in a consolidation phase since early May, maintaining a firm position above the $100,000 level despite several attempts by bears to break it. The only significant dip below this psychological threshold occurred on June 22, and even then, BTC quickly recovered within hours. This resilience highlights the strength of buyer interest at six-figure levels. However, while bulls have successfully defended support, they’ve been unable to push past the critical $110,000 resistance, leading to growing speculation that a correction may be looming.
Adding valuable context to this uncertainty, top analyst Axel Adler shared insights into the Bitcoin Distribution by Realized Supply metric—a tool used to assess how expensive BTC is relative to what investors actually paid for it. Realized Supply calculates the total dollar value of all Bitcoin based on the prices at which coins last moved, offering a more grounded view of valuation.
The metric’s ratio, defined as BTC price / Realized Supply, functions similarly to the P/E ratio in equities. A high ratio can suggest overvaluation, while a low one implies potential undervaluation. Currently, Bitcoin’s price is just slightly above the annual ratio level, putting it in a neutral valuation zone. Interestingly, this is the same setup seen in November 2024, right before BTC surged from $74K to $107K.
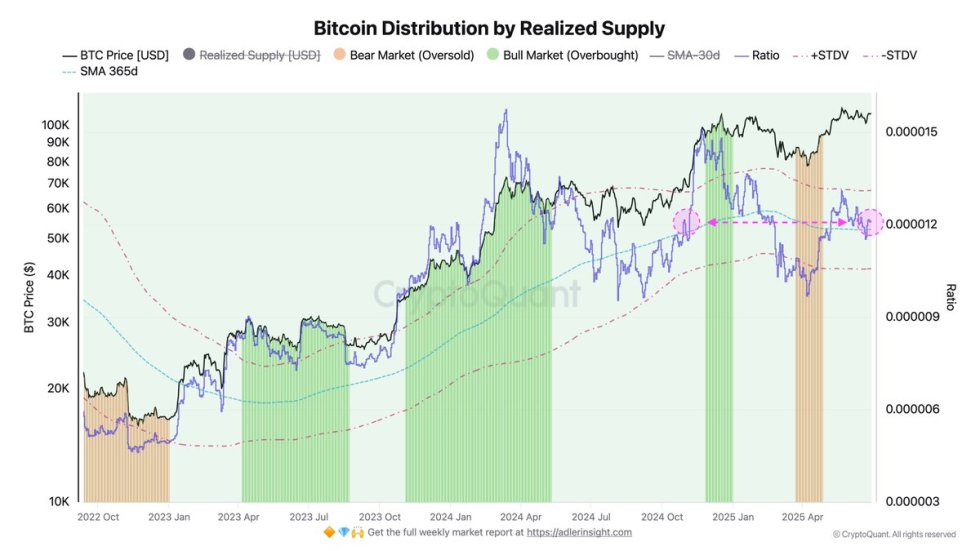
This suggests the market is neither overheated nor undervalued, positioning Bitcoin in a balanced zone where major moves could develop in either direction. As long as BTC remains in this range without a clear breakout or breakdown, traders should stay alert—this phase could be the calm before the next big shift.
BTC Faces Rejection At $109K As Price Consolidates
Bitcoin is currently trading at $107,531 on the 12-hour chart, showing signs of consolidation just below the critical resistance zone at $109,300. This level has acted as a ceiling for over a month, with multiple failed breakout attempts. The latest rejection from this level reflects the ongoing struggle between bulls and bears, as neither side has been able to confirm a decisive move.
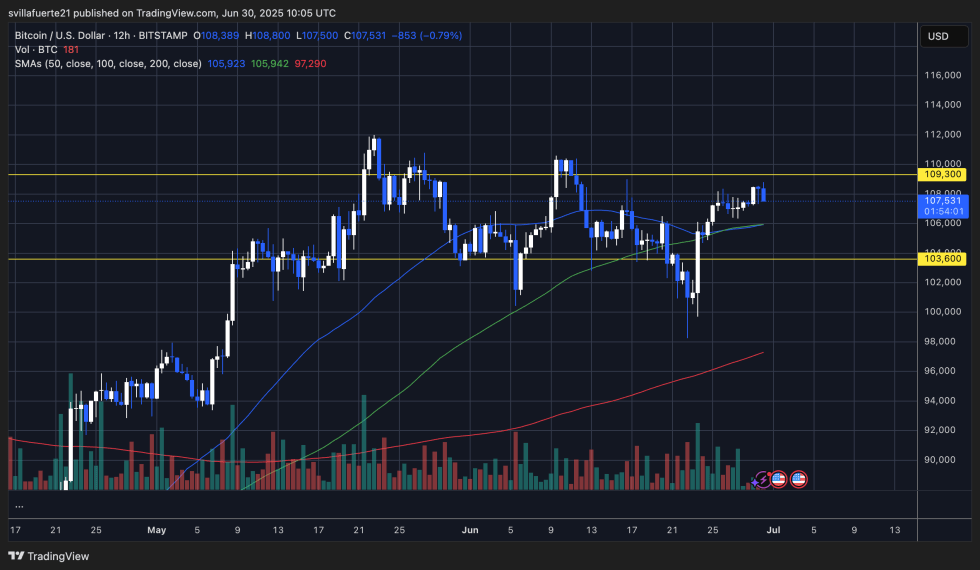
Despite the rejection, the overall structure remains bullish. BTC continues to hold above all key moving averages—50 SMA ($105,923), 100 SMA ($105,942), and 200 SMA ($97,290)—with the 50 and 100 SMAs converging as dynamic support around the $106K level. This alignment favors bullish continuation if buyers can maintain pressure.
Volume has yet to show a convincing surge, indicating that traders are still waiting for confirmation before fully committing to new positions. A strong candle close above $109,300 WOULD likely trigger upside momentum and shift BTC into price discovery. On the flip side, a drop below $105,000 would put the $103,600 support at risk and open the door to a broader pullback.
Featured image from Dall-E, chart from TradingView

Log in to Reply
Log in to comment your thoughtsComments
Related Articles
|Square
Get the BTCC app to start your crypto journey
Get started today Scan to join our 100M+ users