Bitcoin’s Long-Term Holders Are Loading Up Again – History Says $160K Is Next

Bitcoin's patient whales are quietly stacking sats like it's 2020 all over again. The same accumulation pattern that preceded past bull runs just flashed green – and this time, the algorithm says $160K is the magic number.
When diamond hands hoard, markets follow. On-chain data reveals long-term holders now control a staggering 14.9 million BTC – within spitting distance of the all-time high stash seen before previous parabolic moves. These crypto boomers don't budge for 10% swings. They're waiting for the real payday.
The kicker? Retail hasn't even FOMO'd in yet. While Wall Street fund managers still argue about 'store of value' theories over $20 martinis, the OGs are executing the simplest playbook in finance: buy, cold storage, repeat. Just don't tell the guys who sold at $60K.
Bitcoin Consolidates As Long-Term Holders Accumulate Once Again
Bitcoin is currently at a crossroads, holding key structural support yet struggling to define its next move. After rebounding above $105,000, the price remains just 5% away from its all-time high, but market participants are increasingly divided. Some analysts expect a strong breakout above the $110K resistance zone, potentially launching BTC into a new phase of price discovery. Others warn of a possible retracement below $100K, citing waning momentum and uncertain macroeconomic conditions.
Despite this uncertainty, on-chain data from top analyst Axel Adler suggests that Bitcoin’s long-term trend remains intact. Adler highlights a recurring pattern seen in each major rally during this cycle: sustained accumulation by long-term holders (LTH) before sharp price increases. The first notable instance came around the $28K mark, when LTH accumulation over 1–2 months helped fuel the breakout to $60K. A similar phase occurred at $60K, powering BTC’s run to $100K.
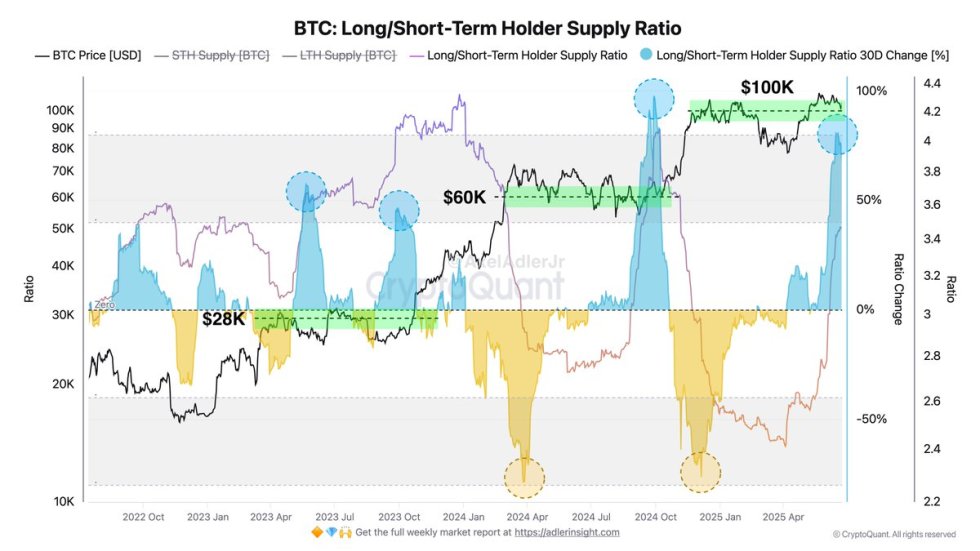
Now, Bitcoin is once again showing a growing LTH/STH ratio near the $100K level. Adler believes this phase of accumulation may last another 4–8 weeks before a potential breakout. If the past is any indication, a conservative price projection using a 1.6x multiplier puts the next rally target at approximately $160,000.
BTC Approaches Critical Resistance Near $109K
The chart shows bitcoin trading at $107,355, pushing firmly into the resistance range between $103,600 and $109,300. After recovering from a brief drop below $100K earlier this month, BTC has climbed steadily and is now less than 2% from the cycle’s key resistance at $109,300. This zone has rejected price several times since March, making a breakout here crucial for confirming entry into price discovery.
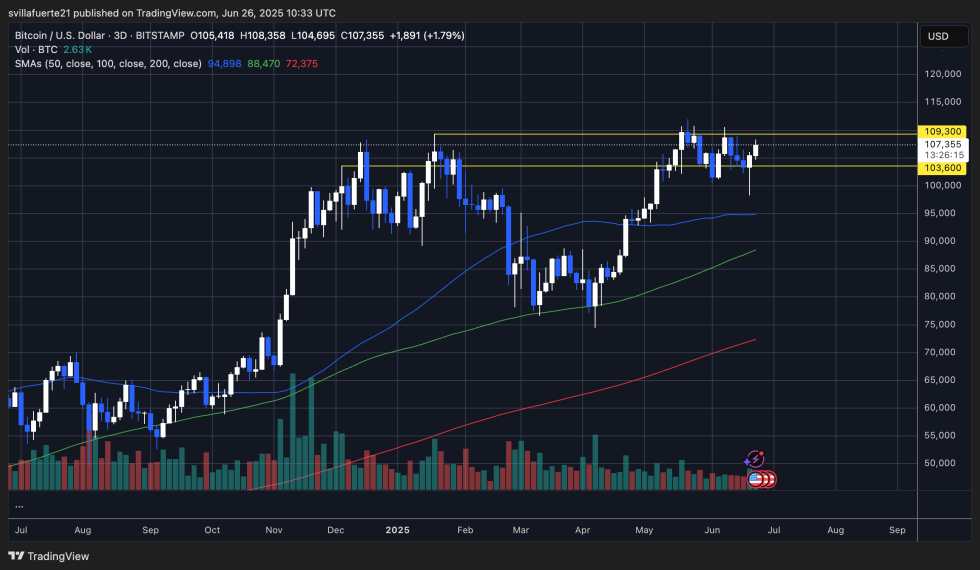
Volume has picked up slightly during the latest move, indicating buyer interest. However, the lack of a volume spike still suggests caution among market participants. The 50-day and 100-day SMAs remain upward-sloping and well below current price levels, confirming bullish structure and providing strong dynamic support at $94,898 and $88,470, respectively. The 200-day SMA trails at $72,375, reinforcing the longer-term uptrend.
If bulls manage to break and hold above $109,300, it could trigger a sharp move upward, fueled by short liquidations and renewed bullish momentum. However, another rejection could signal continued consolidation between the key support at $103,600 and resistance above. This price action reflects the broader indecision in the market, as traders await a clear directional signal amid macroeconomic and geopolitical volatility.
Featured image from Dall-E, chart from TradingView

Log in to Reply
Log in to comment your thoughtsComments
Related Articles
|Square
Get the BTCC app to start your crypto journey
Get started today Scan to join our 100M+ users