Ethereum Price at Crossroads: Bearish Chart Pattern Sparks Market Jitters

Ethereum bulls beware—a ominous technical formation flashes warning signs as ETH struggles to hold key levels.
Market technicians spot trouble in paradise
The second-largest cryptocurrency shows textbook bearish divergence on daily charts, with the 50-day moving average threatening to cross below the 200-day—a dreaded 'death cross' scenario that last preceded ETH's 2022 collapse. Liquidation clusters loom below $3,400, while overleveraged longs gulp nervously.
Institutional traders quietly accumulate puts
Options flow reveals smart money hedging against further downside, with Deribit's put/call ratio hitting three-month highs. 'Everyone's waiting for the ETF approval savior,' quips one OTC desk trader, 'but the charts scream caution.'
The crypto market's perpetual optimism faces its sternest test yet—will Ethereum defy gravity or confirm the bears' narrative? One thing's certain: the next 10% move will separate the diamond hands from the margin-called ghosts.
Is ETH Price Bound For The $1,200 Level Again?
In a June 21st post on the X platform, Chartered Market Technician (CMT) Aksel Kibar painted an interesting bearish picture for the ethereum price over the next few weeks. According to the market expert, the price of ETH could be gearing up for a period of significant downward movement.
The reasoning behind this bearish projection is the price movement of an ascending channel pattern on the Ethereum chart on the weekly timeframe. An ascending channel is a technical analysis pattern characterized by two major (upward-sloping) trendlines: the upper line linking the swing highs and the lower line connecting the swing lows.
Typically, the ascending channel pattern suggests the persistence of an upward price trend. However, a breakout of this channel can be used to identify a trend reversal or continuation. For instance, if a breakout occurs beneath the lower trendline, it suggests that there might be a shift from an upward trend to a downtrend.
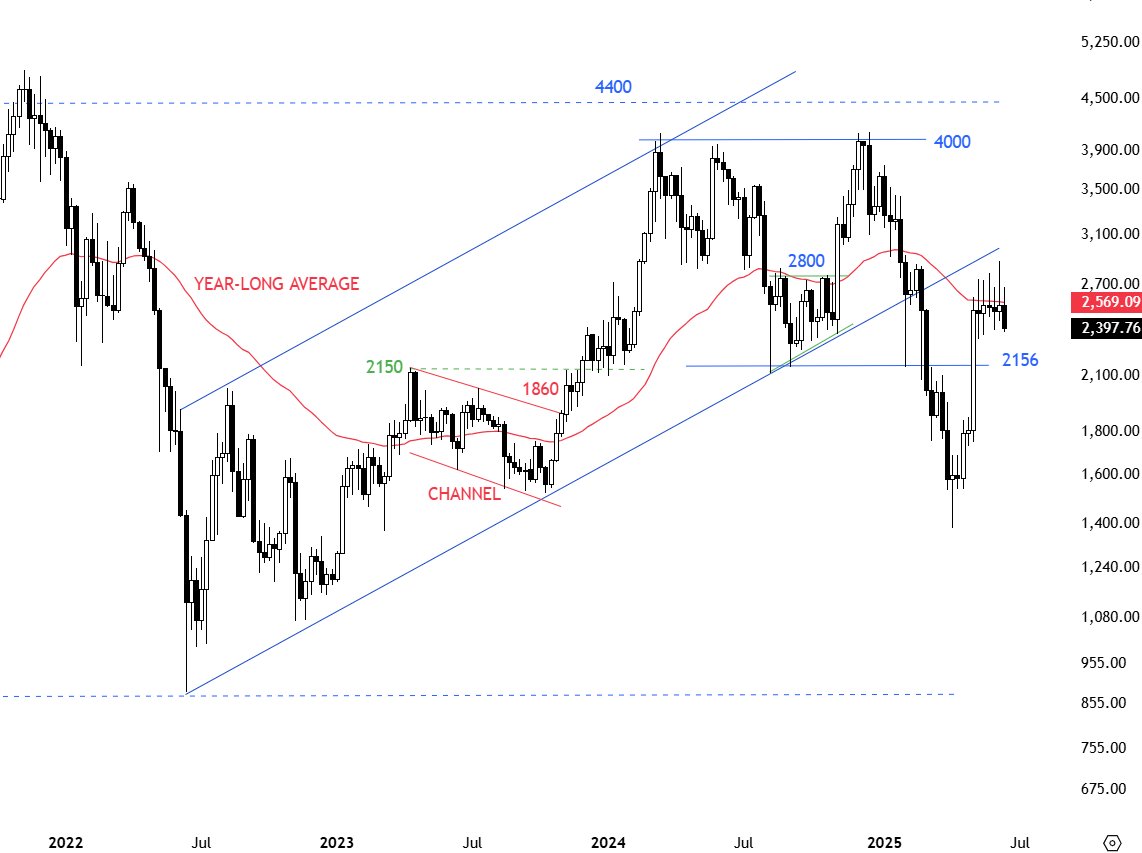
As shown in the chart above, this breakdown was the case for the Ethereum price when it succumbed to significant bearish pressure earlier this year. The altcoin’s value plunged to as low as $1,200 in early April before witnessing a strong resurgence back above the $2,000 level.
In his post on X, Kibar posited that the recent bullish momentum seen with the Ethereum price could be a mere retest of the broken lower channel boundary. If this is the case, the price of ETH may be headed back to $1,200 or even lower — around the $900 region.
Ethereum Price At A Glance
As of this writing, the price of ETH sits just beneath the $2,300 level, reflecting an over 5% decline in the past 24 hours. According to data from CoinGecko, the altcoin is down by nearly 9% on the weekly timeframe.
