Bitcoin Open Interest Plummets 3.5% – Is the Market Braced for a Deeper Correction?

Bitcoin's open interest just took a 3.5% nosedive—traders are sweating, but is this the calm before another storm?
Leverage liquidations loom
The drop hints at shrinking speculative bets—smart money exiting before the next big move? Or just another over-leveraged casino moment in crypto’s endless drama.
Watch the derivatives dominoes
Futures markets are flashing amber. When open interest craters, volatility usually follows. Buckle up—or better yet, hedge like your portfolio depends on it (because it does).
Wall Street’s ‘risk management’ teams will surely time this perfectly—right after they finish their third espresso.
Bitcoin Momentum Wanes As Open Interest Hints At Potential Risk
Bitcoin is currently trading 6% below its all-time high of $112,000, showing impressive resilience amid global uncertainty but lacking the momentum needed to enter full price discovery. The market has held relatively stable above the $100,000 level, yet the inability to push higher reflects hesitation from both institutional and retail investors. Macro headwinds — including rising US Treasury yields, the Federal Reserve’s decision to hold interest rates, and escalating tensions in the Middle East — continue to influence risk sentiment and stall bullish continuation.
According to top analyst Axel Adler, futures market data is beginning to signal cautious repositioning. In the 2024–2025 cycle, deep drawdowns in open interest (OI) between –20% and –25% consistently coincided with local Bitcoin corrections ranging from 7% to 21%. While current OI sits at just –3.5%, suggesting only a moderate reduction in positions, any repeat of the historical pattern could imply a potential BTC price correction of 5–15%.
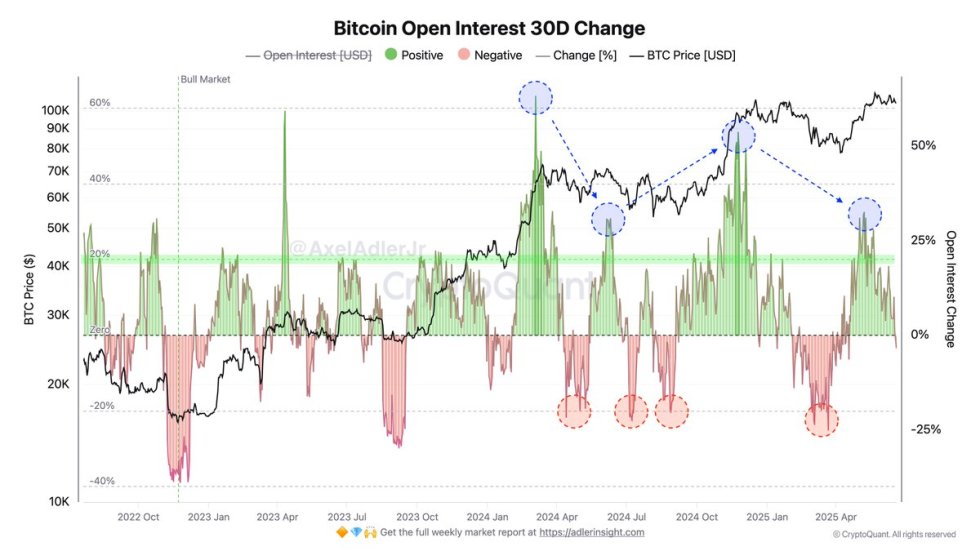
With BTC stuck between major resistance at $112K and key support near $103K, traders are watching derivatives activity closely. For now, the market remains balanced — but not immune to a sharp MOVE if pressure builds.
BTC Price Holds Tight Between Key Levels As Market Awaits Breakout
Bitcoin is currently trading around $105,910, following a modest bounce within a tight consolidation range. This 3-day chart shows BTC caught between the $109,300 resistance zone and the $103,600 support level, which has now been tested multiple times since early June. Despite a slight uptick in volume, price action remains largely indecisive, reflecting market caution.
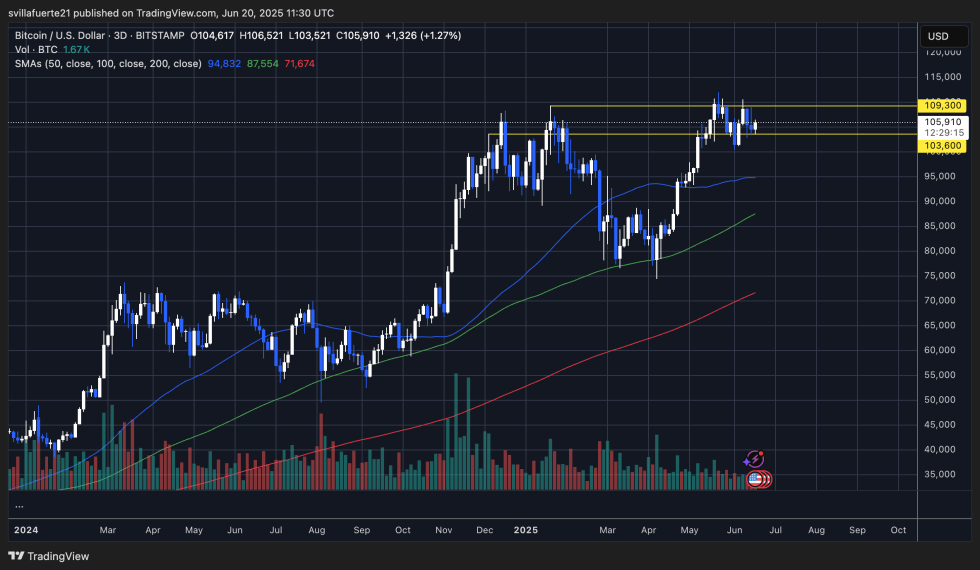
The chart also highlights the significance of the 50-day (blue), 100-day (green), and 200-day (red) simple moving averages. All three trend indicators are sloping upward, with price consistently holding above them — a bullish structural signal. Notably, the 50-day SMA is currently acting as dynamic support near the $100K–$102K range.
As long as BTC remains within this range, traders will look for a breakout above $109,300 to signal renewed bullish momentum and a potential push into price discovery. On the downside, a breakdown below $103,600 could open the door for a retest of the $95K–$98K region, where the 100-day SMA currently aligns.
Featured image from Dall-E, chart from TradingView

Log in to Reply
Log in to comment your thoughtsComments
Related Articles
|Square
Get the BTCC app to start your crypto journey
Get started today Scan to join our 100M+ users