Bitcoin Demand Craters as Whales Dump Holdings – Is This the End of the Bull Run?

Bitcoin's liquidity pool is evaporating faster than a meme coin's promises. Institutional outflows hit record levels this week as the OG crypto struggles to maintain its foothold.
The great capital rotation
Chain analytics show exchange reserves bleeding dry - over $2B in BTC exited custody this month alone. Market makers are pulling bids faster than a DeFi protocol facing an audit.
Retail FOMO is dead
Google search volume for 'buy Bitcoin' sits at 18-month lows. The last time interest was this tepid, BTC traded 60% below current levels. Maybe everyone finally realized they should've bought the dip instead of chasing green candles.
Meanwhile in TradFi land...
Goldman analysts quietly removed their 'digital gold' price targets while maintaining straight faces. Nothing says conviction like a 180-degree pivot wrapped in consultant-speak.
The coming reckoning
With leverage getting flushed and open interest collapsing, Bitcoin's next move could define the cycle. Either this is the healthy reset before the halving rally - or proof that even crypto winters can have second acts.
Volatility Grows But Bitcoin Holds Strong Above Key Support
Bitcoin continues to weather macro and geopolitical turbulence, holding firm above the critical $103,600 support despite growing volatility. As Middle East conflicts escalate and macroeconomic pressures mount—including rising US Treasury yields and persistent inflation risks—financial markets remain fragile. Yet, Bitcoin appears to thrive in this uncertain environment, consolidating with resilience NEAR all-time highs.
Market analysts remain split on what’s next. Some suggest that Bitcoin needs clearer signals, particularly from geopolitical or economic developments, before it can break out in either direction. Others argue that BTC is simply building energy for the next leg up, and price discovery beyond $112,000 is only a matter of time.
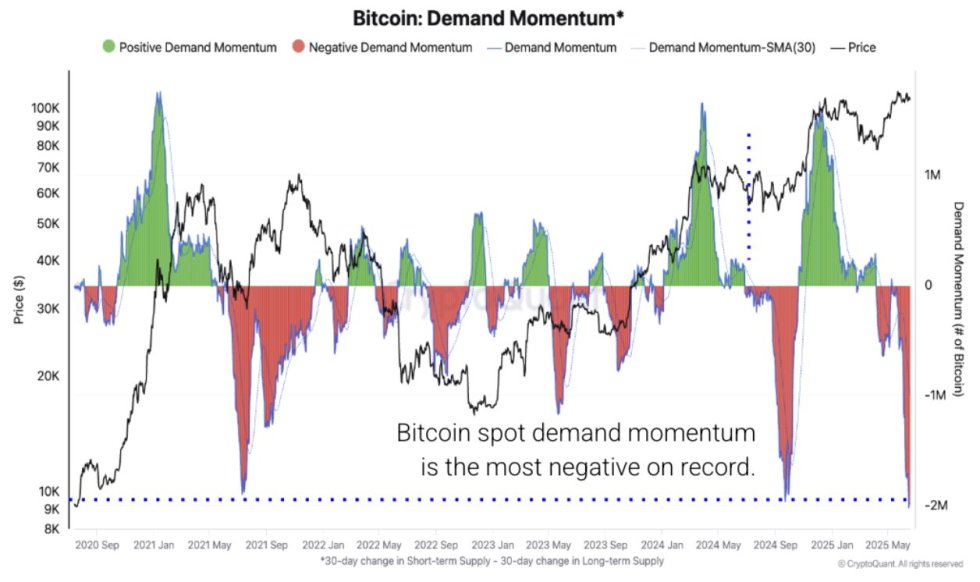
However, recent on-chain data from CryptoQuant suggests that bullish momentum may be fading, at least temporarily. Short-term holders, often the most reactive participants in the market, have reduced their holdings to 4.5 million BTC. That’s a drop of 800,000 BTC since May 27. Even more striking is the demand momentum, which has now fallen to –2 million BTC—the worst reading on record. This suggests new money is no longer entering the market at meaningful levels, dampening the potential for an immediate rally.
Despite these metrics, Bitcoin’s ability to stay above $103,600 reflects underlying strength. As the market enters a potential inflection point, this equilibrium may soon give way to a decisive move—up or down.
BTC Price Holds Steady Within Key Range
The daily Bitcoin chart shows BTC continuing to consolidate within a well-defined range, trading between $103,600 and $109,300. Since reaching its all-time high of $112,000 in late May, price action has flattened, signaling indecision among market participants. The 50-day simple moving average (SMA) is now acting as dynamic support, aligning closely with the $104,700 region, while the $109,300 zone has repeatedly served as resistance, rejecting further upside attempts.

Volume remains relatively low, reflecting a lack of conviction from both bulls and bears. However, despite several tests of the lower boundary near $103,600, Bitcoin has not broken down, suggesting buyers are still absorbing sell pressure and defending the trend. On the upside, any daily close above $109,300 could open the door to a retest of the $112,000 level and potentially new highs.
This tight structure sets the stage for a breakout. Momentum will likely build once the price escapes this zone, especially with macroeconomic uncertainties and geopolitical tensions driving volatility. Until then, traders should monitor how BTC behaves around these boundaries, as a decisive move in either direction will likely dictate short-term market sentiment.
Featured image from Dall-E, chart from TradingView

Log in to Reply
Log in to comment your thoughtsComments
Related Articles
|Square
Get the BTCC app to start your crypto journey
Get started today Scan to join our 100M+ users