Bitcoin Surfs Global Liquidity Tsunami: $150K Target in Sight as Analysts Go Bullish

Bitcoin''s price action is looking more like a big-wave surf competition than a traditional asset—and analysts are placing bets on how high the rally goes. With global liquidity flooding markets, one bold prediction puts BTC at $150,000. Here''s why the smart money (and the reckless gamblers) are loading up.
The liquidity liftoff: Central banks'' money printers haven''t just warmed up—they''re overheating. That tidal wave of capital has to go somewhere, and crypto''s absorbing it like a blockchain sponge.
Technicals screaming buy: On-chain metrics show whales accumulating while retail investors still hesitate—a classic setup for explosive moves. The $150K target isn''t just hopium; it''s math with a side of manic energy.
The cynical kicker: Wall Street still hates Bitcoin—until they finish building their positions. Then suddenly they''ll ''discover'' its store-of-value properties (right around $120K).
Is Bitcoin Tracking Expansion In Global Liquidity?
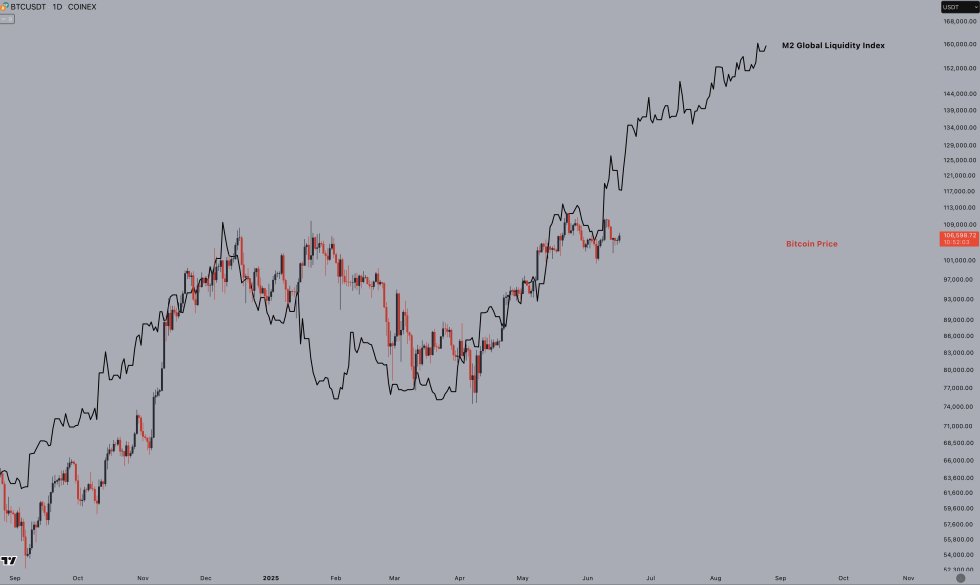
According to a recent X post by crypto analyst Jelle, BTC appears to be following the trajectory of rising global liquidity. The analyst shared the following chart suggesting that Bitcoin is on track to reach a new ATH of $150,000 in the coming months.
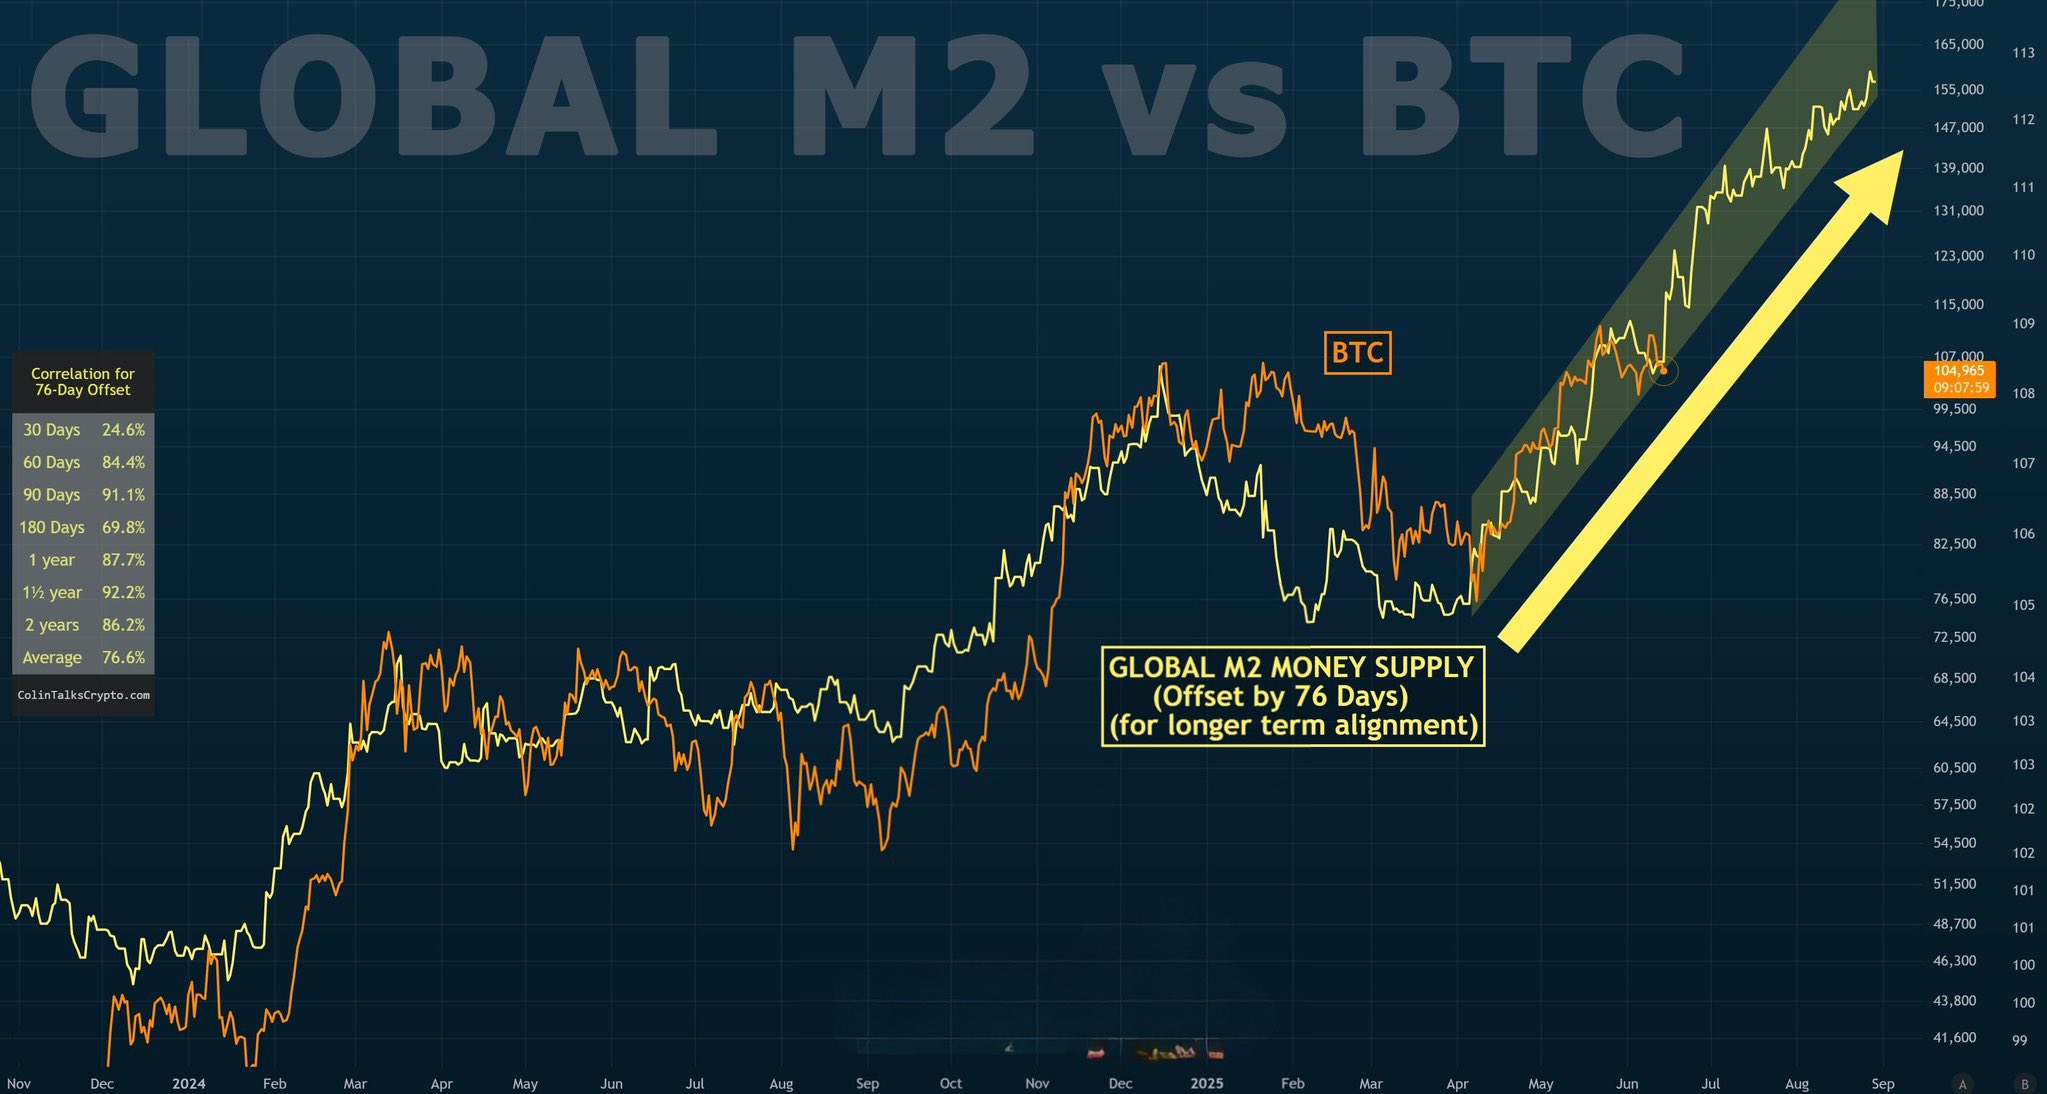
A similar perspective was offered by fellow crypto analyst Master of Crypto. The analyst provided a more detailed explanation of how BTC is aligning with movements in the global M2 money supply.
For the uninitiated, global M2 money supply refers to the total amount of money – including cash, checking deposits, and easily convertible NEAR money – circulating across major economies. It is often used as an indicator of global liquidity, with increases typically supporting asset price growth, including cryptocurrencies like Bitcoin.
Master of Crypto shared the following chart comparing BTC’s price with movements in global M2 money supply, using a 76-day lag. He noted that this time-offset metric has historically offered more accurate long-term signals, and correlates with Bitcoin’s price at a rate of 76%.
In related analysis, crypto trader Merlijn The Trader drew comparisons between gold’s price pattern and that of BTC. He shared the following chart indicating that bitcoin is mirroring gold’s cup and handle pattern, which often signals continued price appreciation.
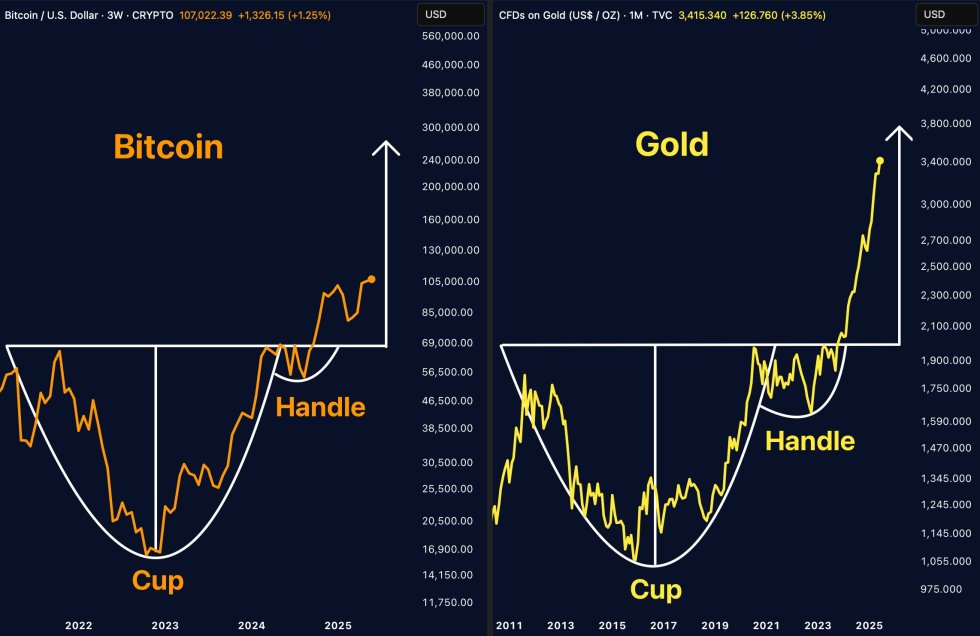
To explain, the cup and handle pattern is a bullish formation that resembles a rounded “cup” followed by a brief consolidation or “handle” before a breakout. It typically indicates a continuation of the existing uptrend, often leading to new highs.
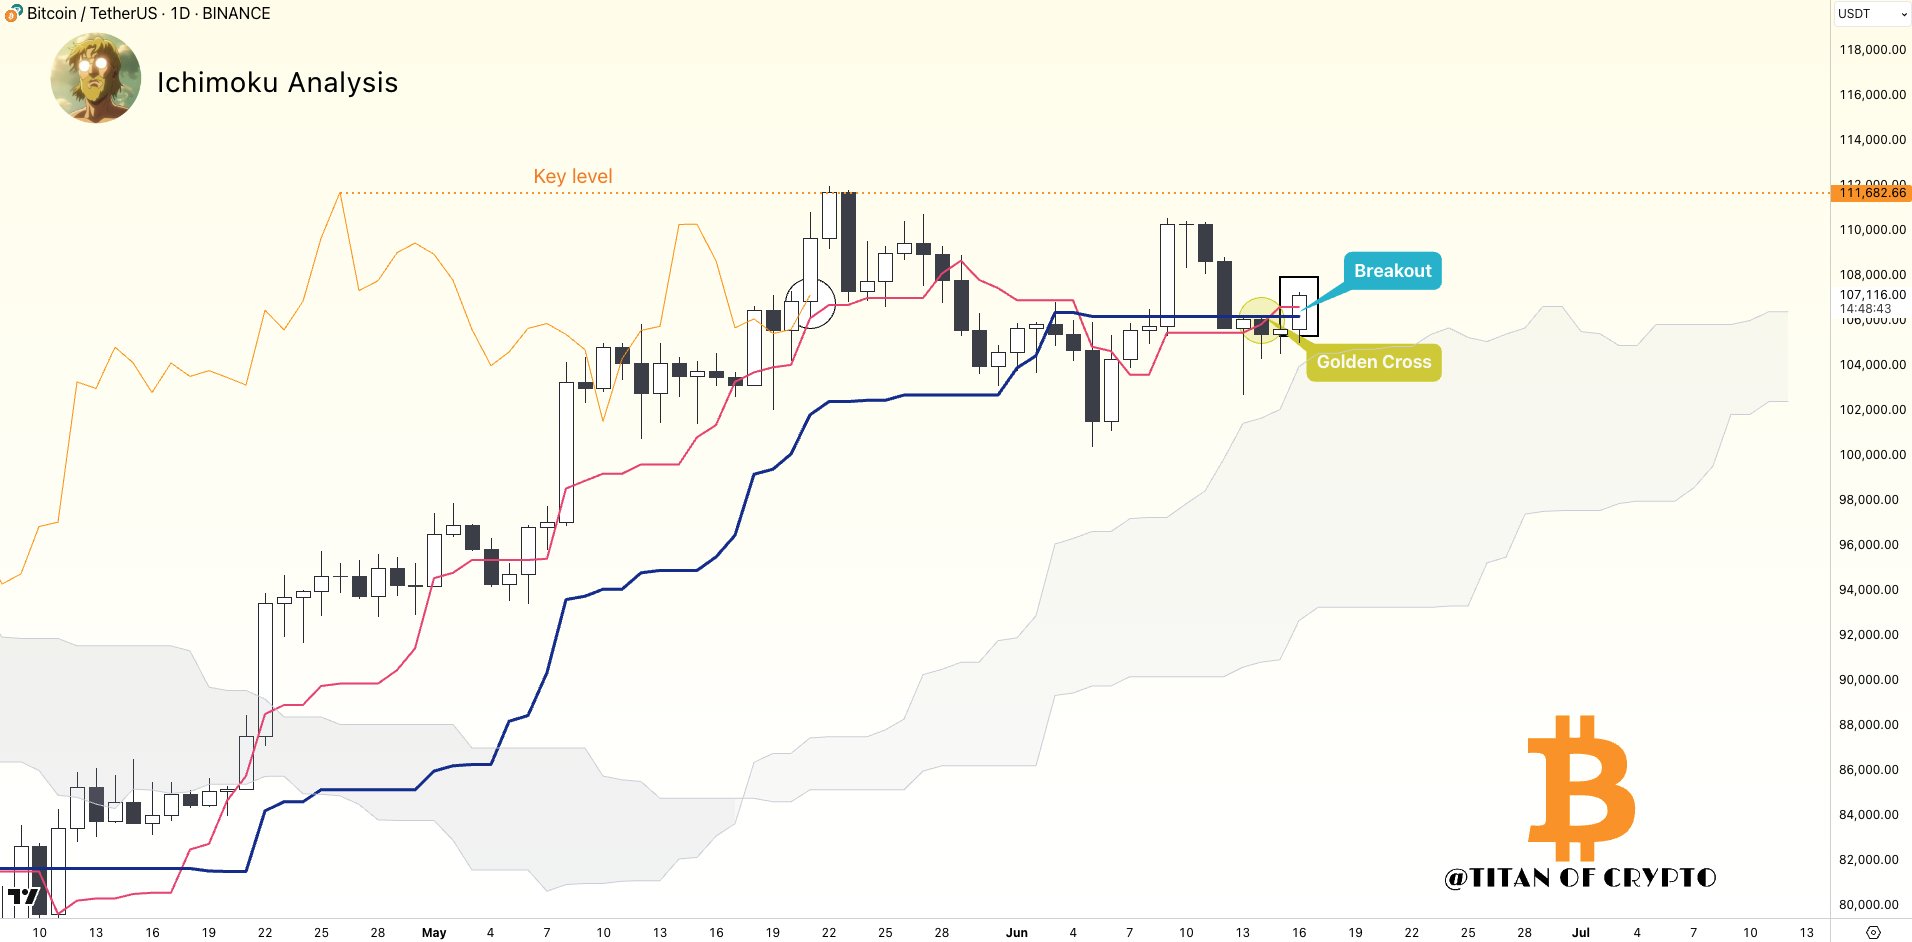
Meanwhile, noted analyst Titan of Crypto pointed out a golden cross formation on the daily BTC chart. The last time this pattern appeared – back in April 2025 – BTC experienced a parabolic rise, ultimately hitting an ATH of $111,682.
More Room To Run For BTC
Several on-chain and macro indicators suggest that BTC may still have more upside in this cycle, especially when compared to previous rallies. Notably, the current market lacks widespread retail investor participation, implying that the rally has yet to enter a euphoric phase.
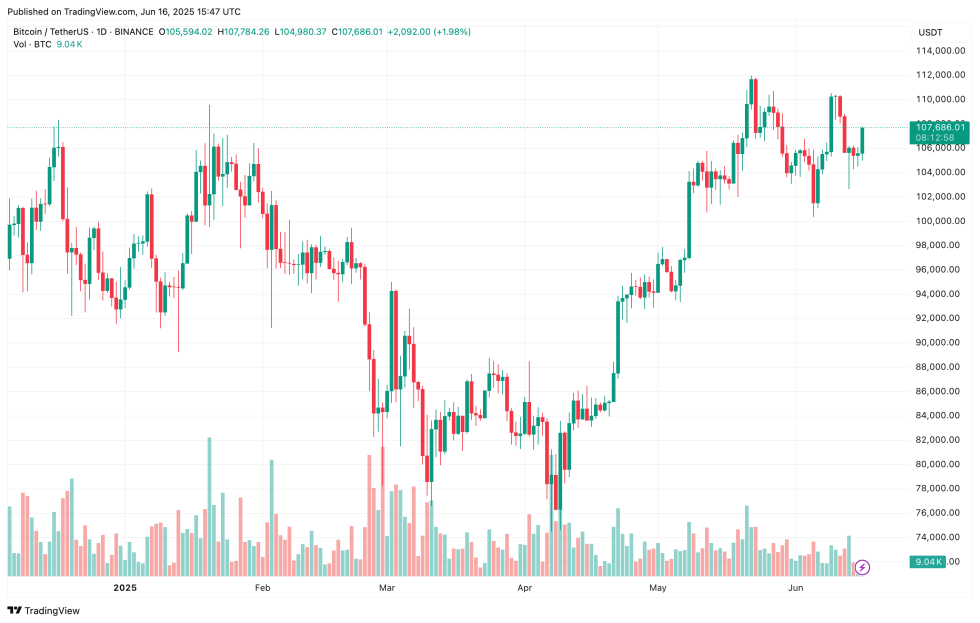
Similarly, the Puell Multiple continues to signal that the bull run is intact. However, a recent spike in miner-to-exchange transfers has raised concerns about a potential sell-off. At press time, BTC trades at $107, 686, up 1.8% in the past 24 hours.