Bitcoin CEX Inflows Plunge Below 1-Year Average – Bullish Pause or Stealth Accumulation?

Bitcoin''s exchange inflows just dipped under their 365-day average—is this the calm before the storm or a sign of weakening momentum?
CEX traffic slows: On-chain data shows BTC deposits to centralized exchanges dropping below the yearly trendline. Traders are either losing faith... or playing the long game.
The bull case: Fewer coins hitting exchanges could mean hodlers are digging in—supply squeeze incoming. The bear trap: Maybe everyone''s just waiting for the next ''institutional adoption'' press release to dump bags.
One thing''s certain: Wall Street''s still trying to short crypto with leveraged ETFs while pretending they invented blockchain. Some things never change.
Bitcoin Consolidates Amid Uncertainty And Slower Liquidity Flows
Bitcoin has entered a consolidation phase following an expansive rally that lifted prices from the $74,000 level to an all-time high NEAR $112,000. This pullback comes amid a complex macroeconomic environment marked by rising US Treasury yields, inflation fears, and escalating geopolitical tensions, particularly the unfolding conflict between Israel and Iran. These overlapping risks have weighed heavily on investor sentiment, making the coming weeks pivotal in determining Bitcoin’s next major move.
Despite the volatility, many analysts remain optimistic, expecting bitcoin to reclaim its previous highs and enter price discovery. Market participants continue to monitor on-chain and liquidity metrics to gauge sentiment and conviction.
One key insight comes from Axel Adler, who shared that back in December 2024—when BTC traded in the $98K–$100K range—daily inflows of USDT and USDC into centralized exchanges peaked at $131 billion. As of June 2025, those flows have dropped to $70 billion per day, which is $5 billion below the 365-day average and $61 billion under the December high.
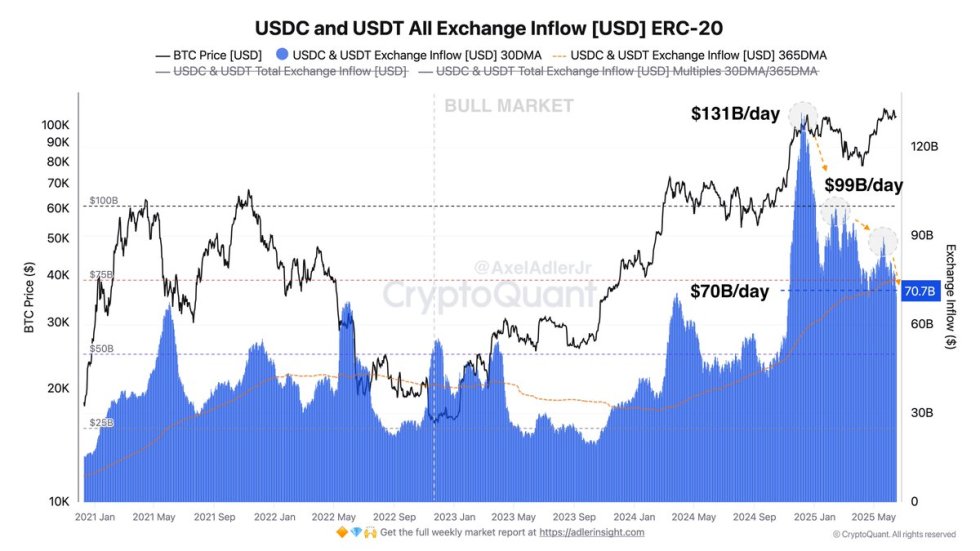
This notable decline in liquidity reflects a cooling of speculative momentum. However, BTC holding above $100K suggests that long-term holders remain committed, and widespread selling has not occurred. This signals that the market may be undergoing a healthy period of base-building before another breakout.
Price Action Remains Steady Within Key Range
The 12-hour Bitcoin chart shows BTC trading at $106,881, holding above the key $103,600 support level that has acted as a base since late May. Despite recent volatility caused by geopolitical tensions and macroeconomic uncertainty, Bitcoin remains in a consolidation zone between $103,600 and $109,300, respecting both the lower and upper boundaries of this range.
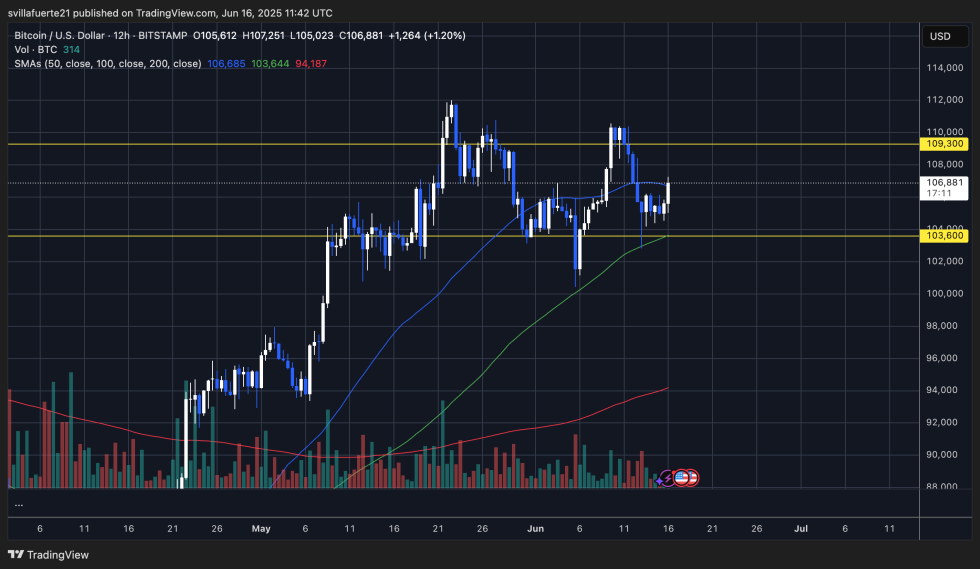
Price is currently pushing off the 100-day SMA (green line), indicating that buyers are stepping in at dynamic support levels. A bullish crossover of the 50-day and 100-day SMAs further supports short-term upward momentum. However, BTC is still trading below the $109,300 resistance, which continues to act as a strong supply zone. A decisive breakout above this level could confirm trend continuation and set the stage for another test of the all-time high at $112K.
Volume remains relatively stable but lacks the strength seen in prior impulsive moves. If Bitcoin can build momentum and close above $107K with strong buying volume, it may pave the way for a breakout. On the downside, a loss of $103,600 WOULD invalidate the current structure and likely lead to further retracement toward the 200-day SMA, currently near $94,000. For now, the structure favors patient bulls.
Featured image from Dall-E, chart from TradingView
