Ethereum Primed for Explosive Rally – ETH/BTC Chart Flashes Strong Buy Signal

Ethereum's brewing a storm against Bitcoin—and the charts scream opportunity. A bullish technical setup hints at a parabolic surge, leaving traders scrambling to reposition.
Forget the Wall Street playbook—crypto moves at its own reckless pace. While traditional markets obsess over Fed whispers, ETH/BTC quietly paints the most compelling narrative in digital assets right now.
One hedge fund manager yawns, checks his vintage Rolex, and mutters something about 'irrational exuberance.' Meanwhile, the smart money's already loading up.
Ethereum Eyes Breakout After Holding Critical Support
Ethereum has seen a 14% retrace since the last week of May, but despite the pullback, it continues to hold firmly above the $2,400 support zone — a level that has acted as a floor during the recent correction. While market sentiment has been shaky, Ethereum’s ability to maintain this structure has analysts growing increasingly optimistic. The price action suggests consolidation rather than weakness, with bulls preparing for a potential breakout in the coming sessions.
ETH remains down significantly from its yearly highs, but a recovery could be underway. The $2,800 resistance is now the critical barrier for a bullish continuation. Reclaiming that level would confirm a breakout from the current range and open the door to retesting the $3,000–$3,200 region. Some analysts argue that this recovery could mark the start of Ethereum catching up with Bitcoin’s lead, especially if it starts gaining strength in the ETH/BTC pair.
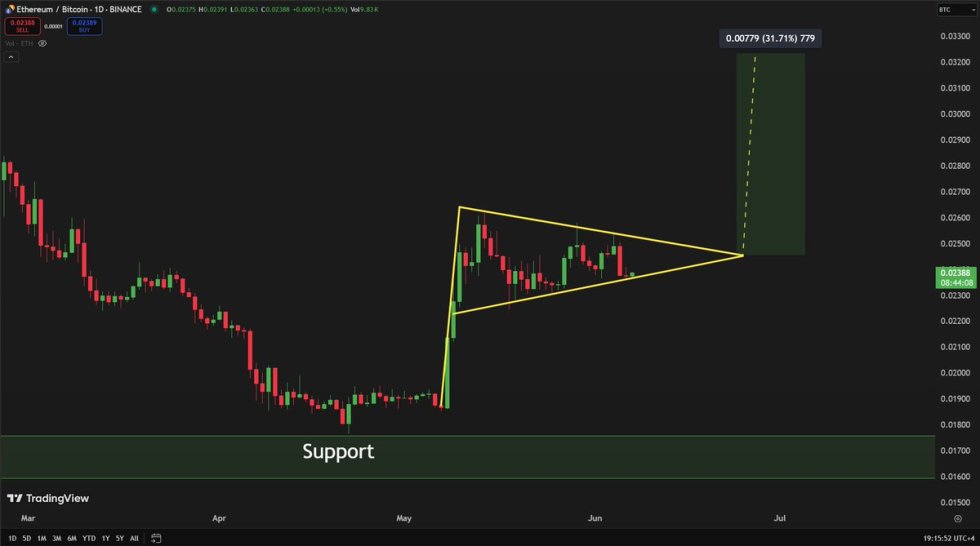
Runefelt recently pointed to a bullish pennant forming on the ETH/BTC chart, suggesting that Ethereum may be on the verge of a parabolic move. The key level to watch is around 0.026 BTC. A confirmed breakout above this threshold could signal the start of altseason, as Ethereum tends to lead the way during major altcoin rotations.
For now, ETH is at a critical crossroads. Holding above $2,400 gives bulls a strong foundation, but follow-through is needed. A breakout in both USD and BTC pairs WOULD validate the bullish case and likely trigger broader upside across the altcoin market. With momentum building and a technical setup aligning, Ethereum’s next move could shape the market direction well into the summer.
ETH Consolidates Below Resistance As Bulls Defend $2,430 Support
Ethereum is trading at $2,516 on the daily timeframe, consolidating just below key resistance at the 200-day simple moving average (SMA), currently at $2,663. After a strong rally in May, ETH has entered a sideways range and is now retesting the 34-day exponential moving average (EMA) at $2,431 — a critical level that previously acted as a springboard for the most recent push higher.
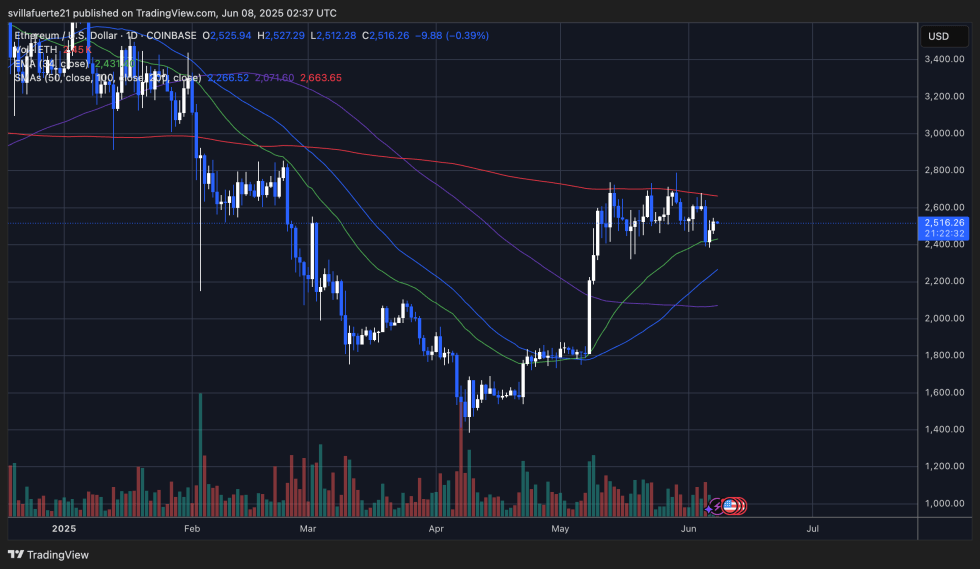
Despite several attempts, Ethereum has been unable to break above the $2,800 zone, forming a clear horizontal resistance capped by the 200-day SMA. This repeated rejection highlights growing selling pressure at the top of the range. However, the overall structure remains intact as long as ETH holds above $2,430. A daily close below this level could trigger further downside toward the 100-day SMA NEAR $2,266.
Volume has declined during this consolidation, suggesting a lack of conviction from both bulls and bears — a setup that typically precedes a breakout. If bulls can reclaim the 200-day SMA, momentum may quickly return, with $2,800 as the next critical breakout level.
Featured image from Dall-E, chart from TradingView
