Bitcoin Stalls as Stocks Outperform: Correction or the Start of a New Trend?

For the past two weeks, Bitcoin's price action has been overshadowed by traditional equities—raising eyebrows across crypto circles. Is this just a breather before the next leg up, or are macro forces shifting the game?
While Wall Street plays its usual short-term theater, Bitcoin's fundamentals remain unshaken. Remember: stocks recover, but sound money evolves.
Bitcoin Stalls Below ATH As Market Awaits Direction
Bitcoin could be setting the stage for a decisive move as it holds firm above $100K, despite recent weakness across global markets. While the leading cryptocurrency has outperformed most asset classes this year—rallying over 50% from its April lows—momentum has stalled just below the $112K all-time high. The current pause comes amid growing systemic risks, with the US economy entering a tight financial environment marked by rising bond yields, stubborn inflation, and increasing trade tensions with China.
According to Daan, Bitcoin has underperformed equities over the past two weeks, diverging from its usual leadership during volatile macro periods. While BTC led the rally during the recent tariff drama, it has since entered a phase of consolidation, even as stocks hover NEAR their local highs. This signals a weakening correlation between traditional markets and digital assets.
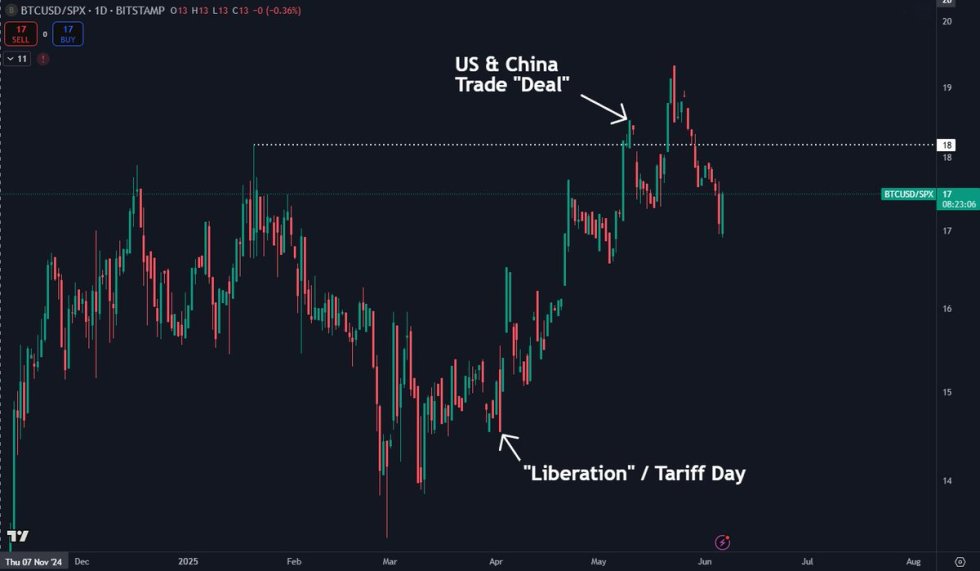
Historically, Bitcoin has often been a leading indicator of broader risk sentiment, moving ahead of equities both on the upside and the downside. The question now is whether this stall is a temporary breather before a renewed breakout or an early sign of a deeper correction.
With macro pressures intensifying, Bitcoin’s reaction in the coming days will be critical. A successful push above $112K WOULD signal renewed strength, while a drop below $103K could expose downside risk.
BTC Weekly Chart Analysis: A Critical Zone Below All-Time Highs
Bitcoin is currently consolidating just below its all-time high of $112K, trading around $104,571 on the weekly chart. After reaching highs of $106,854 this past week, BTC has shown signs of rejection near the $109,300 resistance level — a zone that has now been tested multiple times in this cycle. Despite a slight weekly decline of around 1.07%, the price still remains firmly above the $103,600 support zone, a key level to watch going forward.
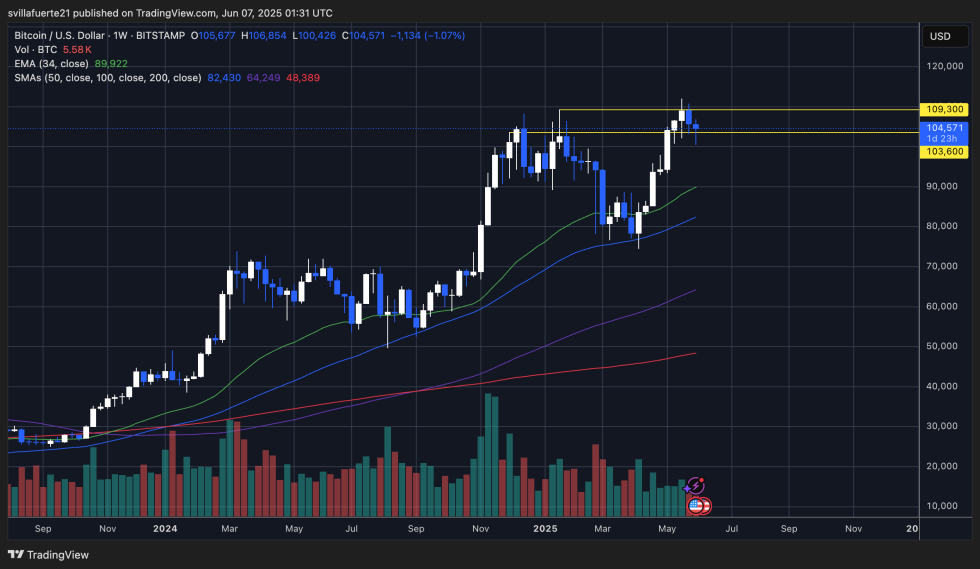
The chart shows BTC still trading well above its 34-week EMA (currently at $89,922), suggesting that the longer-term bullish structure remains intact. The consolidation within this $103K–$109K range may represent healthy price digestion before a potential breakout attempt.
Volume on the weekly chart has decreased slightly from recent peaks, indicating less aggressive participation in the most recent push. However, as long as BTC stays above $103,600 and maintains its ascending trend, the bulls remain in control. A strong breakout above $109,300 could open the door to price discovery and a run beyond $115K.
Conversely, a breakdown below the support range would signal short-term weakness and potentially trigger a deeper correction toward the $95K–$100K zone.
Featured image from Dall-E, chart from TradingView
