Bitcoin Hash Ribbons Trigger Rare Buy Signal – Is This the Start of the Next Mega Rally?

Miners capitulated—now the recovery begins. Bitcoin's hash ribbons, a historically reliable bottom indicator, just flashed green for the first time in over a year. Cue the institutional FOMO.
The signal suggests miner sell pressure has exhausted itself—typically the precursor to a new bullish phase. Past triggers led to gains of 200%+ within 12 months. But this cycle's different: spot ETFs now absorb sell pressure while Wall Street plays catch-up.
Of course, traditional finance will call it a 'speculative bubble' right until they quietly allocate 2% of their pension funds. Timing? Uncertain. Opportunity? Glaring.
Key Signal Suggests Bitcoin Is Ready To Move
Bitcoin could be on the verge of a major move as it consolidates below its all-time high of $112,000. The market remains tense, with bulls holding control but facing pressure from rising macroeconomic risks, including the ongoing bond market stress and escalating global trade tensions. If BTC fails to reclaim momentum and drops below critical demand levels, it could trigger a deeper correction. However, a breakout above $112K would likely reignite bullish sentiment across the crypto space.
Darkfost highlighted a key technical signal that’s flying under the radar—a new buy signal from the Hash Ribbons indicator. This metric assesses stress levels in the Bitcoin mining ecosystem by comparing the 30-day and 60-day moving averages of the network hashrate. When the short-term average crosses above the long-term average after a period of capitulation, it typically signals that miner sell pressure is easing and accumulation may follow.
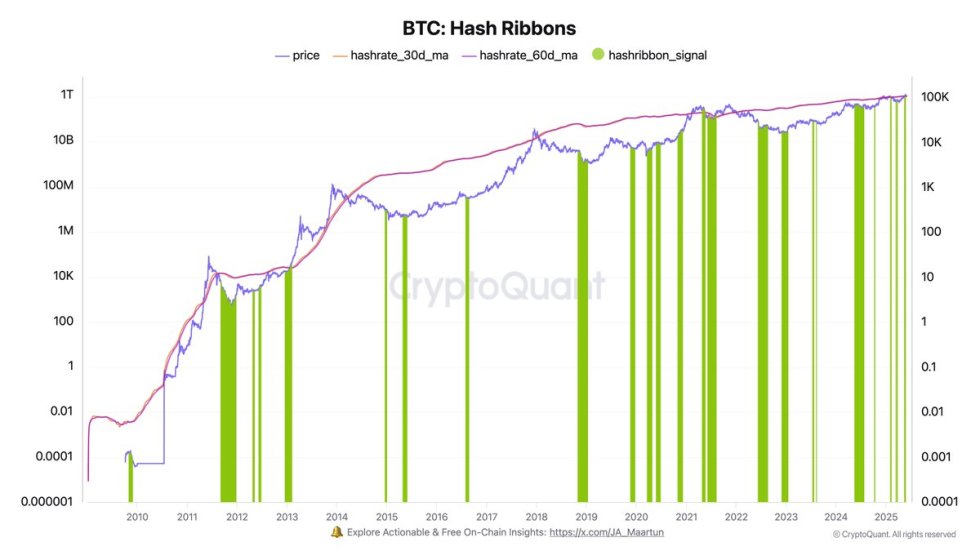
While these periods of miner stress can be short-term bearish—since some miners are forced to liquidate BTC to stay solvent—they often present high-quality entry points for long-term investors. Notably, the recent Hash Ribbons buy signal aligns with Bitcoin’s hashrate reaching new all-time highs, reflecting network resilience despite price stagnation.
If bulls take advantage of this setup, the market could see a strong push toward a new price discovery phase. But failure to hold above key support levels may open the door for a retest of the sub-$100K zone. As always, the next few sessions will be crucial in determining Bitcoin’s trajectory for the weeks ahead.
Daily Chart Analysis: Support Holds, Momentum Awaits Confirmation
Bitcoin continues to consolidate between the $103,600 support and $109,300 resistance zone, as seen on the daily chart. After reaching a new all-time high NEAR $112,000, the price retraced and is now holding slightly above the 34-day EMA at $103,298. This moving average, alongside the $103,600 horizontal level, acts as the key demand zone bulls must defend to maintain the current bullish structure.
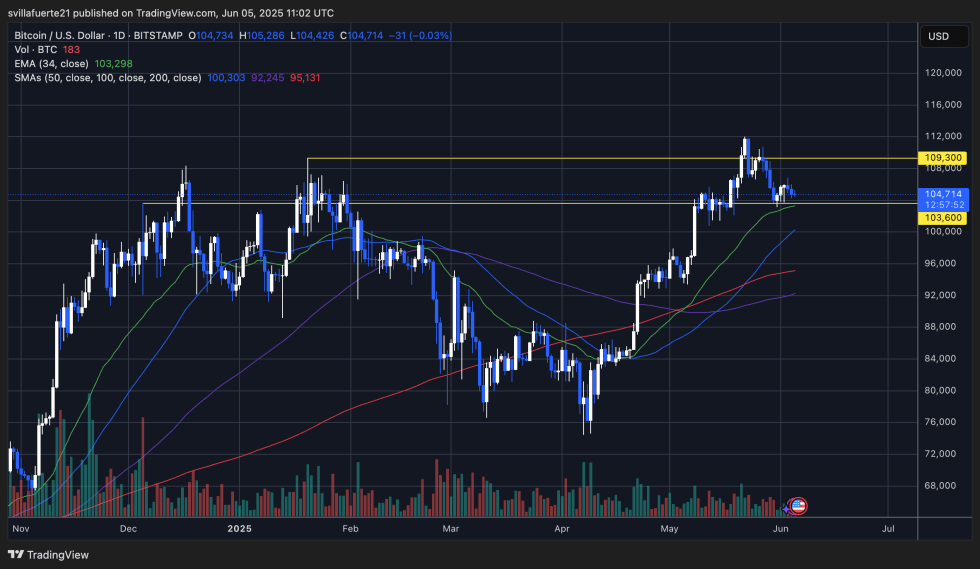
Despite the recent pullback, BTC remains in a broader uptrend, supported by higher lows since the March bottom. However, momentum is clearly fading as daily candles show lower highs and declining volume. A break above $109,300 WOULD likely re-ignite bullish momentum and pave the way for a potential push toward new all-time highs.
On the downside, a confirmed break below $103,600 could trigger a sharper correction, with the next key support at the 100-day SMA near $92,245. Traders should watch for a daily close outside of this range to determine the next directional move.
Featured image from Dall-E, chart from TradingView
