Bitcoin Teeters at Make-or-Break 200-Day Moving Average – Will Bulls Charge or Retreat?

Crypto traders white-knuckle their keyboards as Bitcoin flirts with the 4-hour MA 200—a line in the sand separating hope from despair. The king of crypto hasn’t seen this level of tension since the last ’generational buying opportunity’ turned into a margin call massacre.
Technical crossroads: Bounce here, and bulls might just salvage their overleveraged longs. Break below? Cue the ’I told you so’ chorus from goldbugs and central bankers.
Bonus cynicism: Wall Street’s ’digital gold’ narrative looking shakier than a stablecoin backed by a politician’s promise.
Bitcoin Tests Support As Market Awaits Directional Break
Bitcoin is now testing a critical demand zone around the $103,000 level, following a sharp rejection from the $112,000 all-time high. After several failed breakout attempts in recent days, momentum has shifted, and BTC is pulling back amid a broader market cooldown. The move has increased short-term uncertainty, but the price still remains within a high-timeframe bullish structure.
Macroeconomic tensions continue to shape the crypto landscape, with rising US Treasury yields pointing to deeper systemic stress. Investors are navigating heightened volatility as global markets react to ongoing US-China trade disputes and mixed economic signals. Despite this, Bitcoin’s pullback may present a healthy consolidation phase rather than a trend reversal, provided bulls defend critical support levels.
Cheds highlights that Bitcoin is fast approaching the 4-hour 200 moving average, currently NEAR $102,500. This is a historically reliable dynamic support level that has marked key reversal points in previous bull phases. A successful defense of this level could signal the end of the retracement and initiate the next leg higher. However, a breakdown below it could open the door for a deeper correction toward the $98K–$100K zone.
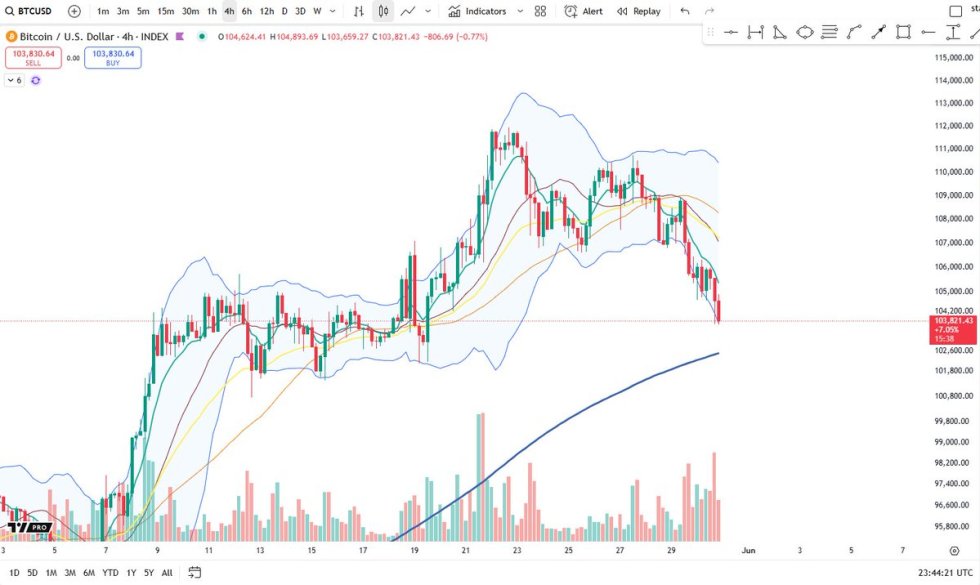
As BTC hovers near support, the coming sessions will be decisive. Holding above the 4H MA 200 could reignite bullish sentiment and restore upward momentum, while failure to do so may shift focus toward more defensive trading setups across the crypto market.
BTC Tests Daily Support Zone After 7% Retracement
Bitcoin is now trading near $103,300, testing the key support level marked by the previous range high at $103,600. After reaching a new all-time high at $112,000 earlier this week, BTC has pulled back over 7%, triggering a wave of uncertainty across the market. This support zone aligns with the 34-day EMA at $102,548, making it a pivotal area to watch for bulls aiming to regain momentum.
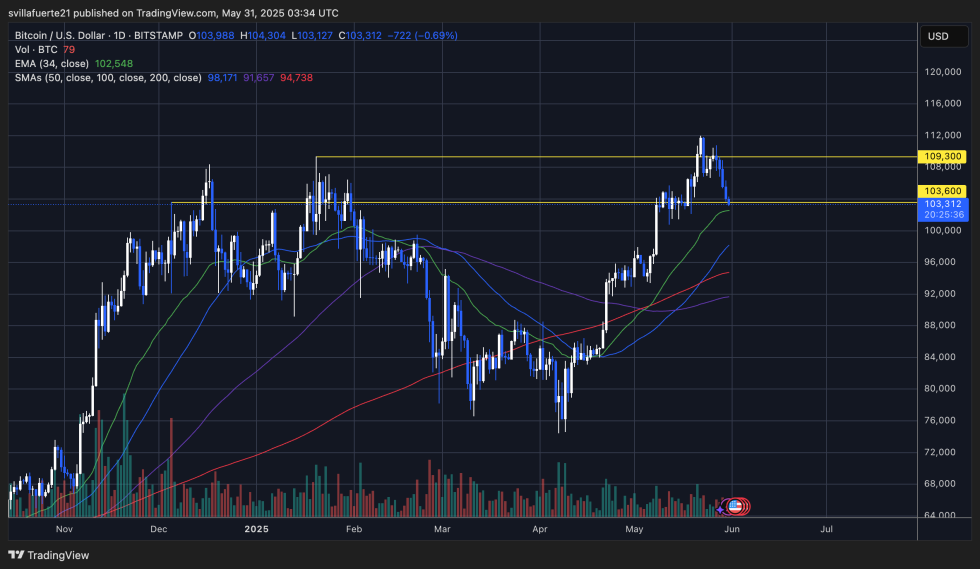
The chart shows BTC holding a strong uptrend structure despite the recent decline. Volume has increased slightly on this drop, suggesting some profit-taking but not yet panic selling. Price is still trading above all major daily moving averages, including the 50-, 100-, and 200-day SMAs, which remain upward-sloping—a signal that long-term trend structure is intact.
A bounce from current levels WOULD confirm $103,600 as a new support floor and open the door for another attempt to reclaim the $109,300 resistance. However, if bears break below this zone, downside risk increases with the next major demand area around $98,000. With macroeconomic stress building and Bitcoin’s previous rally overextended, consolidation at this level may be necessary before the next leg up.
Featured image from Dall-E, chart from TradingView
