Ethereum Defies Gravity—200-Day EMA Holds as Traders Eye $3,300 Breakout

Ethereum’s price action just pulled off a high-wire act—bouncing off its 200-day exponential moving average like a crypto trapeze artist. Now, bulls are betting the house on a surge toward $3,300.
Technical traders are circling charts like vultures, spotting textbook support at the key EMA level. Meanwhile, retail investors are piling in—because nothing screams ’sound investment strategy’ like chasing momentum during macroeconomic turbulence.
The real question? Whether ETH can turn this tightrope walk into a full-blown bull run. One thing’s certain: Wall Street’s watching—and probably preparing to take credit if it works.
Ethereum Looks Poised For A Breakout
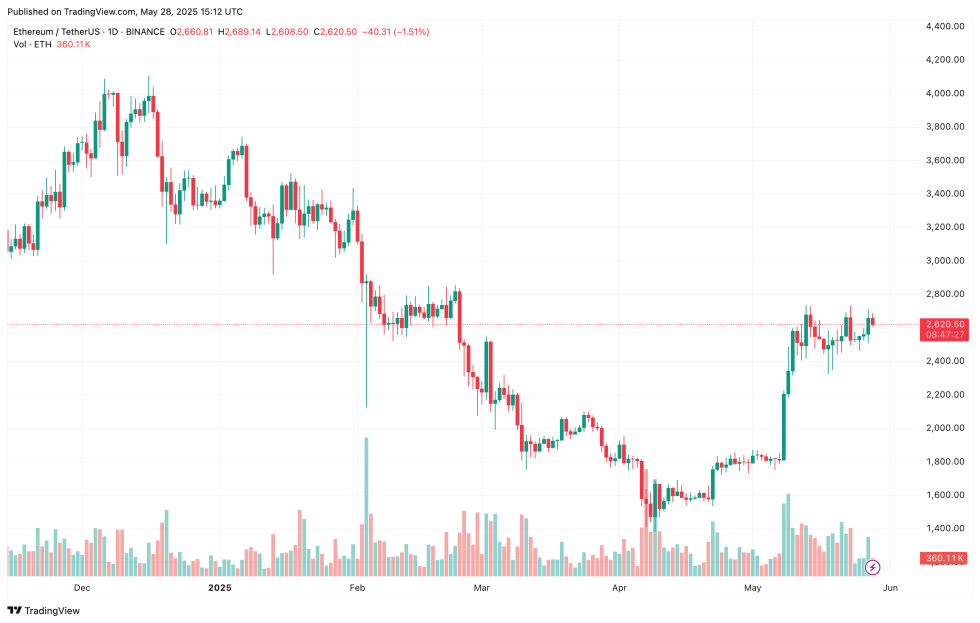
According to a recent CryptoQuant Quicktake post by contributor ibrahimcosar, the daily ETH chart indicates a breakout from a bull flag formation. The analyst shared the following chart to illustrate ETH’s next possible move.

For the uninitiated, A bull flag pattern is a bullish continuation pattern that forms after a strong upward price movement – the flagpole – followed by a period of consolidation within parallel lines – the flag. It typically signals that the asset may break out upward and continue its prior uptrend.
Notably, ETH has been consolidating between $2,400 and $2,700 for the past 17 days. This consolidation – combined with the prior upward momentum – has formed a classic bull flag pattern on the daily chart.
In addition, ETH has remained above the 200-day Exponential Moving Average (EMA) during this same period. The analyst emphasized the bullish implications of this technical signal, stating:
Staying above the 200-day EMA is a bullish signal, and it’s highly likely that in the next strong move, we could see ETH in the $3000–$3500 range. This is the kind of clear bullish signal we’ve seen before major rallies in the past.
Further, ibrahimcosar noted that Ethereum’s movement often serves as a bellwether for the altcoin market. Historically, when ETH rallies, other altcoins tend to follow suit. A breakout in ETH could thus trigger broader gains across the crypto market.
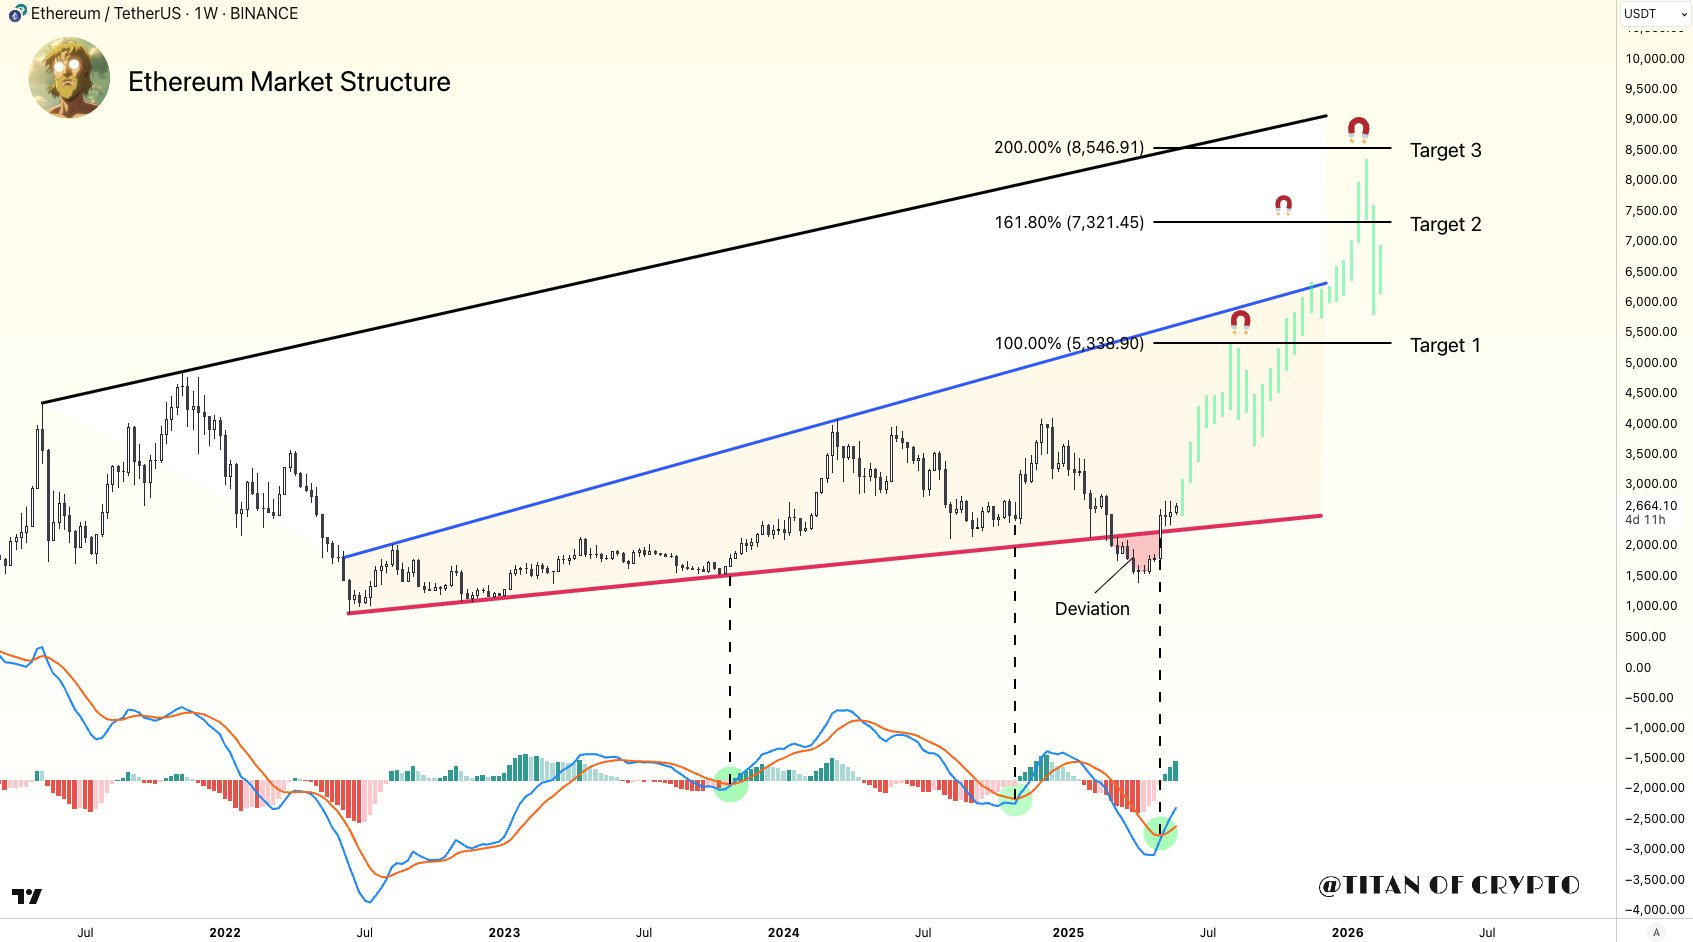
Meanwhile, noted crypto analyst Titan of Crypto shared the following weekly chart illustrating potential ETH price targets if it sustains its current bullish trajectory. The chart shows ETH hitting as high as $8,500 by the beginning of 2026.
What Are ETH Whales Anticipating?
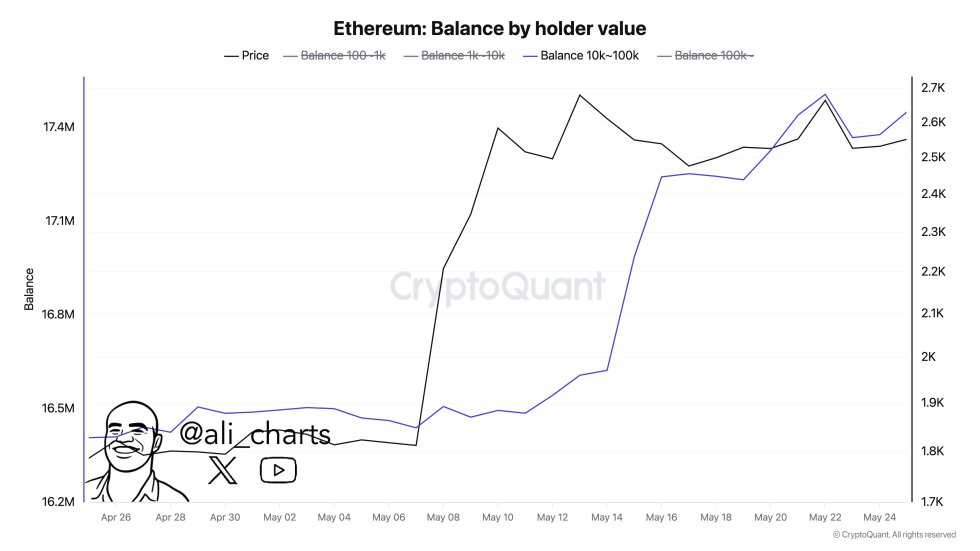
In a separate post on X, crypto analyst Ali Martinez observed that ethereum whales – wallets holding 10,000 to 100,000 ETH – have accumulated over 1 million ETH in the past month.
Similarly, Web3 growth manager Cas Abbe recently remarked that ETH is starting to show signs of life once again. The executive predicted that ETH may reach $4,000 by Q3 2025.
That said, hurdles remain. Blockchain analytics firm Glassnode recently stated that once ETH reaches $2,800, it may witness strong selling pressure which can derail its bullish momentum. At press time, ETH trades at $2,620, down 1% in the past 24 hours.

Log in to Reply
Log in to comment your thoughtsComments
Related Articles
|Square
Get the BTCC app to start your crypto journey
Get started today Scan to join our 100M+ users