Ethereum’s Inverse Head-and-Shoulders Signals Bullish Breakout – $2,700 in Sight

Ethereum’s chart flashes a classic reversal pattern—traders are betting big on a surge past $2,700. Here’s why the smart money’s paying attention.
Technical traders love nothing more than a textbook pattern, and ETH’s inverse head-and-shoulders setup is screaming ’buy.’ The neckline breach could send prices rocketing—if it holds.
Wall Street analysts would call this ’price discovery.’ Crypto traders? Just another Tuesday. Either way, the bulls are back in charge—for now.
Ethereum Needs To Lead To Confirm Altseason
While many analysts continue to call for an incoming altseason, most agree on one key requirement: Ethereum must reclaim higher levels above $3,000 to lead the charge. As the second-largest cryptocurrency by market cap, ETH historically acts as the gateway for broader altcoin rallies. Without its participation, the likelihood of a full-scale altseason remains low.
Currently, Ethereum is trading near $2,500, consolidating after a failed attempt to break through the $2,700 resistance zone earlier in the week. Despite this rejection, Optimism remains high. Analysts like Ted Pillows believe ETH is simply setting the stage for a larger breakout. In his latest analysis, Pillows highlights a developing inverse head and shoulders pattern on the 12-hour chart—an established bullish structure often preceding trend reversals.

According to Pillows, a breakout above the $2,700 neckline would be a strong technical confirmation, likely triggering a rapid MOVE toward the $3,000 level. “If ETH closes above $2,700 with momentum, it won’t take long to reach $3,000,” he noted.
Many also believe Ethereum’s explosive move could come shortly after Bitcoin finishes its impulsive push above all-time highs. Once BTC cools down, capital may rotate into ETH and large-cap altcoins, fueling a new leg higher across the board.
Price Action Details: Key Levels To Watch
Ethereum is currently trading at $2,512 on the 4-hour chart after failing to break through the $2,700 resistance earlier in the week. The chart shows ETH consolidating between $2,470 and $2,700, forming what appears to be the right shoulder of a developing inverse head and shoulders pattern—a potential bullish reversal setup that traders are watching closely.
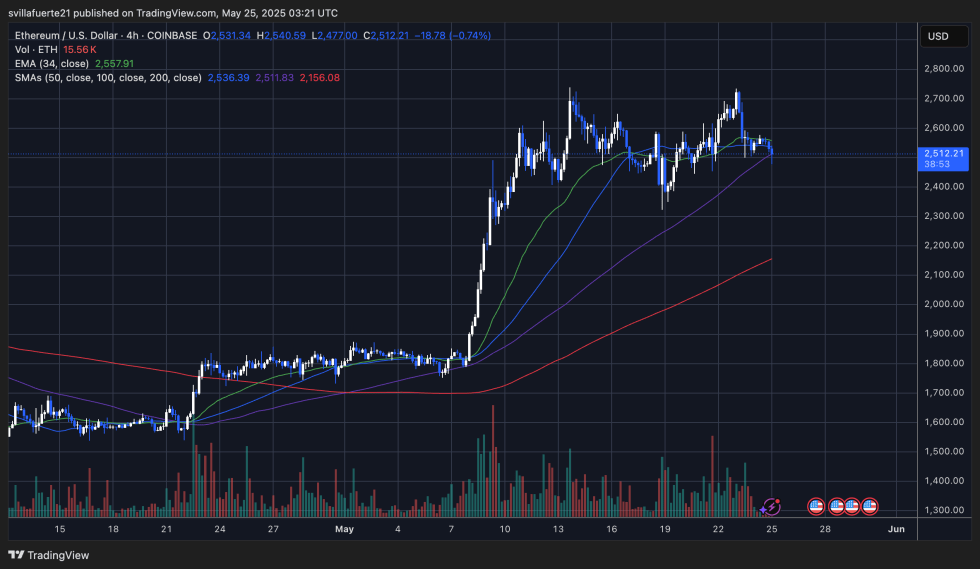
The 34 EMA (green) sits at $2,557, and ETH is now trading just below it, signaling short-term weakness. However, the 100 SMA (purple) at $2,511 is offering immediate support, and bulls will need to defend this level to avoid a deeper correction toward the 200 SMA, currently NEAR $2,156.
Volume has declined during the recent pullback, suggesting that selling pressure may be losing steam. As long as ETH holds above $2,470 and avoids a breakdown below the neckline of the pattern, the setup remains valid. A confirmed breakout above $2,700 would likely trigger a quick move toward the psychological $3,000 level.
The next few sessions will be crucial. Ethereum needs to reclaim the 34 EMA and gain momentum above $2,600 to confirm strength. Otherwise, a failure to hold support could delay the anticipated breakout and stall altseason hopes.
Featured image from Dall-E, chart from TradingView

Log in to Reply
Log in to comment your thoughtsComments
Related Articles
|Square
Get the BTCC app to start your crypto journey
Get started today Scan to join our 100M+ users