Bitcoin Exchange Volumes Nosedive – Smart Money Hoarding or Retail Giving Up?

Exchange wallets haven’t been this quiet since the depths of the 2022 crypto winter. Trading activity flatlined after July 2022—but is this the calm before the storm or mass capitulation?
Whales loading up or apathy setting in? The data screams accumulation phase, but Wall Street ’experts’ still can’t decide if Bitcoin’s dead or just playing possum. Meanwhile, your traditional savings account still loses to inflation—but hey, at least it’s FDIC insured.
Bitcoin Low Exchange Volume Adds Fuel To Bullish Outlook
Bitcoin is showing resilience in the face of macroeconomic headwinds. While U.S. equities dipped yesterday due to rising yields in Treasury Bonds, bitcoin climbed steadily, signaling that market participants may be rotating capital into hard assets amid uncertainty. This relative strength highlights BTC’s appeal as a hedge, particularly when traditional markets waver.
However, despite the bullish momentum, a key hurdle remains at the $115,000 level. Breaking above this resistance WOULD confirm the next phase of the rally and open the door to higher price discovery. Conversely, a failure to hold above current levels around $110,000 could invite a swift correction back to previous support zones. Traders are watching closely, as volatility could rise quickly.
Top analyst Axel Adler added meaningful context to the broader trend. According to Adler, after the Luna collapse in 2022, weekly trading volumes for the BTC/USD pair on centralized exchanges (CEXs) have plummeted—from 2.9 million BTC in July 2022 to just 426,000 BTC this week.
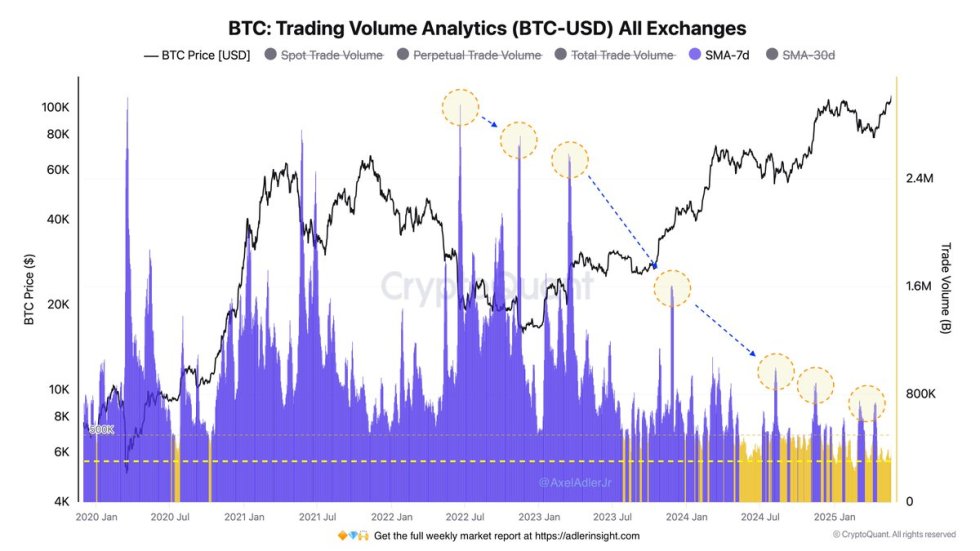
This long-term decline in exchange activity is viewed as a bullish structural shift. It signals a MOVE toward long-term holding behavior and a tightening of available supply. With fewer coins circulating on exchanges, sell-side pressure is reduced, creating a supportive backdrop for continued upward price action.
BTC Price Action Shows Strong Momentum
Bitcoin is trading at $110,855 after briefly reaching $111,163, signaling strong upward momentum and continuation of the bullish trend. On the 4-hour chart, BTC has consistently posted higher lows and higher highs since the bounce off the $100K support level on May 15. The recent breakout above the $108K resistance level triggered a surge in buying volume, pushing BTC into uncharted territory.
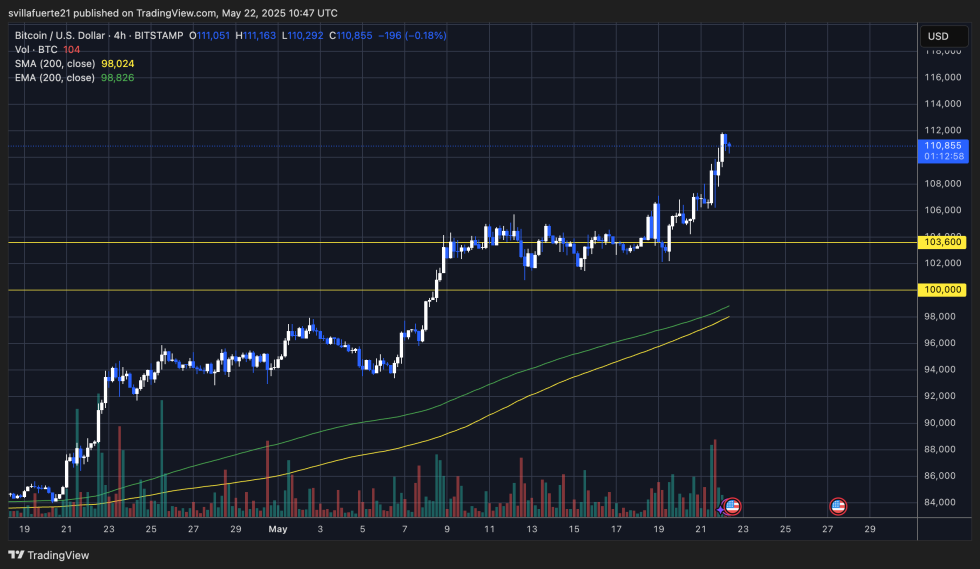
Key technical indicators support the bullish bias. The 200-period simple moving average (SMA) at $98,024 and the 200-period exponential moving average (EMA) at $98,826 are trending upward, confirming strong underlying trend support. Volume spikes in the last two sessions also suggest strong conviction from buyers as BTC entered price discovery.
However, the price is beginning to show signs of potential exhaustion. The latest candles exhibit long wicks on the upper side, hinting at selling pressure NEAR local highs. If BTC fails to maintain momentum, a retest of the $108K breakout level could occur. Immediate support lies around $103,600, with $100K as the psychological floor.
Featured image from Dall-E, chart from TradingView
