Bitcoin’s Daily Chart Echoes 2018 – Is a Monster Breakout Imminent?

Bitcoin’s price action is squeezing tighter than a Wall Street banker’s grip on a bonus—and the setup looks eerily familiar. The daily chart mirrors 2018’s compression before its explosive 300% rally. Traders are leaning forward in their seats.
Key parallels:
- Symmetrical triangle formation identical to pre-breakout 2018 structure
- Volatility contraction to levels not seen since the last cycle’s launchpad
- RSI coiling at neutral 50, just like before the big moves
Market makers are either about to trigger a generational buying opportunity or the mother of all bull traps. Either way, leverage traders will get vaporized—some things never change in crypto.
With the halving dust settled and ETFs sucking up supply, the technicals suggest we’re not just at a crossroads—we’re at a coiled spring. Will history rhyme again, or is this time ’different’ (like every banker claims before the crash)?
Compression Builds As Bitcoin Struggles Near All-Time High
Bitcoin is currently facing a pivotal moment in its market structure as it tests resistance levels just below its all-time high. The price surged to $108,000 but continues to struggle against key supply zones that are capping bullish momentum. Despite the impressive rally since April, when BTC gained over 40% in value, many analysts are now calling for a retrace if bulls fail to deliver a convincing breakout. A critical support level at $100,000 is now the line in the sand. Losing it could trigger a deeper correction and shake short-term investor confidence.
While the technical setup points to potential upside, the market sentiment doesn’t yet reflect the typical euphoria seen NEAR ATH levels. Instead, the tone remains cautious. Liquidity continues to build above the $108,000 mark, and a decisive push beyond that could finally initiate the next phase of price discovery.
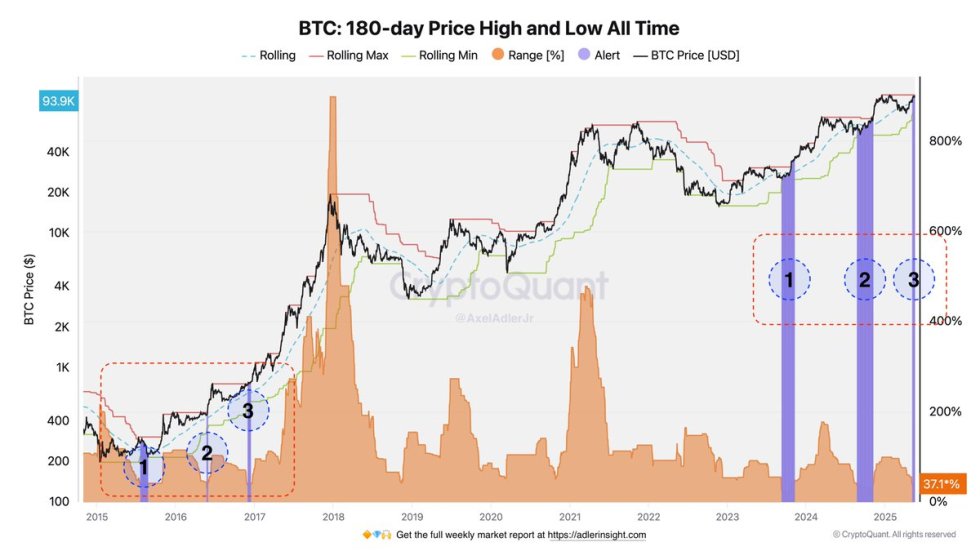
Top analyst Axel Adler adds weight to the bullish case, noting that on the daily timeframe, compression is building up once again, marking the third such event in this bull cycle. Historically, a trio of compressions preceded the explosive 2018 rally. Adler suggests that the current price action resembles a tightly coiled spring, ready to release. Whether that energy resolves upward or downward remains to be seen, but the setup signals a large move is imminent.
In short, Bitcoin remains caught between growing bullish pressure and looming market hesitation. A clean break above $109,000 could confirm the start of an impulsive rally, but if sellers take control, a sharp retrace could follow. Either way, volatility is on the horizon.
Technical Details: BTC Flirts With ATH
Bitcoin continues to trade within a tight consolidation range on the 4-hour chart, holding above the key $103,600 support level. After reaching a local high of around $108,000, BTC saw a sharp rejection that brought it back to $106,166 at the time of writing. This price action reflects rising indecision in the market as bulls defend higher lows but fail to push into new highs above the ATH.
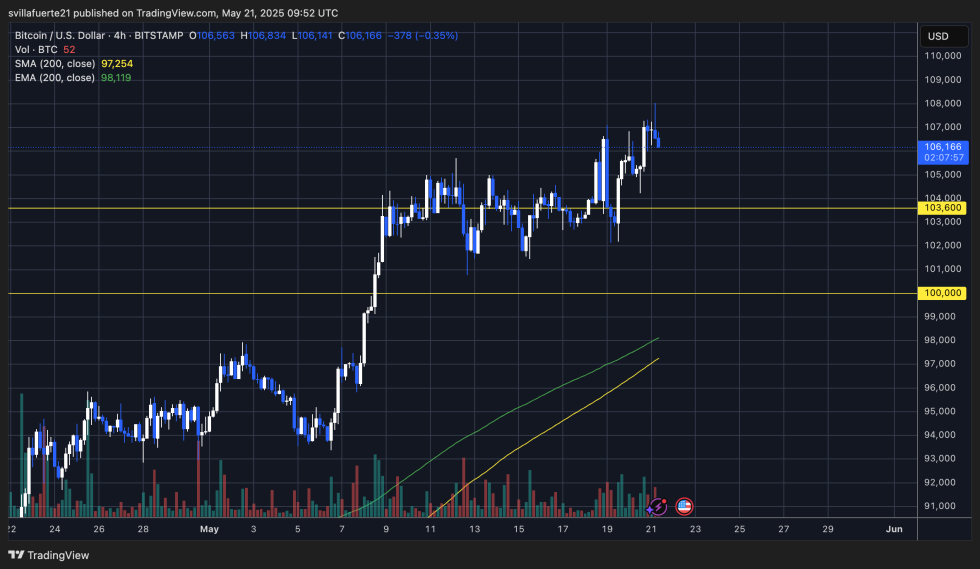
The 200 EMA and 200 SMA are well below the current price at $98,119 and $97,254, respectively, reinforcing a bullish structure in the medium term. Volume remains relatively stable but has not shown the strength typically needed to break out of a consolidation pattern. This suggests that traders are still waiting for a clearer directional signal.
If BTC breaks above the $108K resistance, a retest of the $109K ATH becomes likely. However, failure to hold above $103,600 could trigger a deeper pullback, with the $100K level acting as a critical psychological and technical support zone.
Featured image from Dall-E, chart from TradingView

Log in to Reply
Log in to comment your thoughtsComments
Related Articles
|Square
Get the BTCC app to start your crypto journey
Get started today Scan to join our 100M+ users