Bitcoin’s Pricing Bands Flash Bullish Signal – $117K Target in Play

Technical traders are circling as Bitcoin’s pricing bands suggest a potential moonshot to $117,000. The pattern mirrors previous pre-bull run formations—just before institutional FOMO kicks in.
Why this matters: When Bitcoin’s volatility bands tighten like this, it typically precedes explosive price action. The last time we saw this setup? Right before the 2021 rally to $69,000.
Cynical take: Wall Street will ’discover’ this chart pattern just in time to sell the top to retail (again). Meanwhile, crypto natives stack sats quietly.
Pricing Bands: Next Resistance At $116,900, Support At $98,131
The Bitcoin MVRV extreme deviation bands are statistical bands based on standard deviations of the MVRV ratio from its historical mean. They help identify extreme overvaluation and undervaluation in the Bitcoin market, and thus are useful tools in pointing out resistance and support levels. According to the chart presented by Ali Martinez on May 16, Bitcoin’s next major resistance lies at $116,901, which aligns with the +1σ (standard deviation) MVRV band. A price break above this level would signify a risky overvaluation of BTC’s price and an overheated market, hinting at much potential for profit taking.
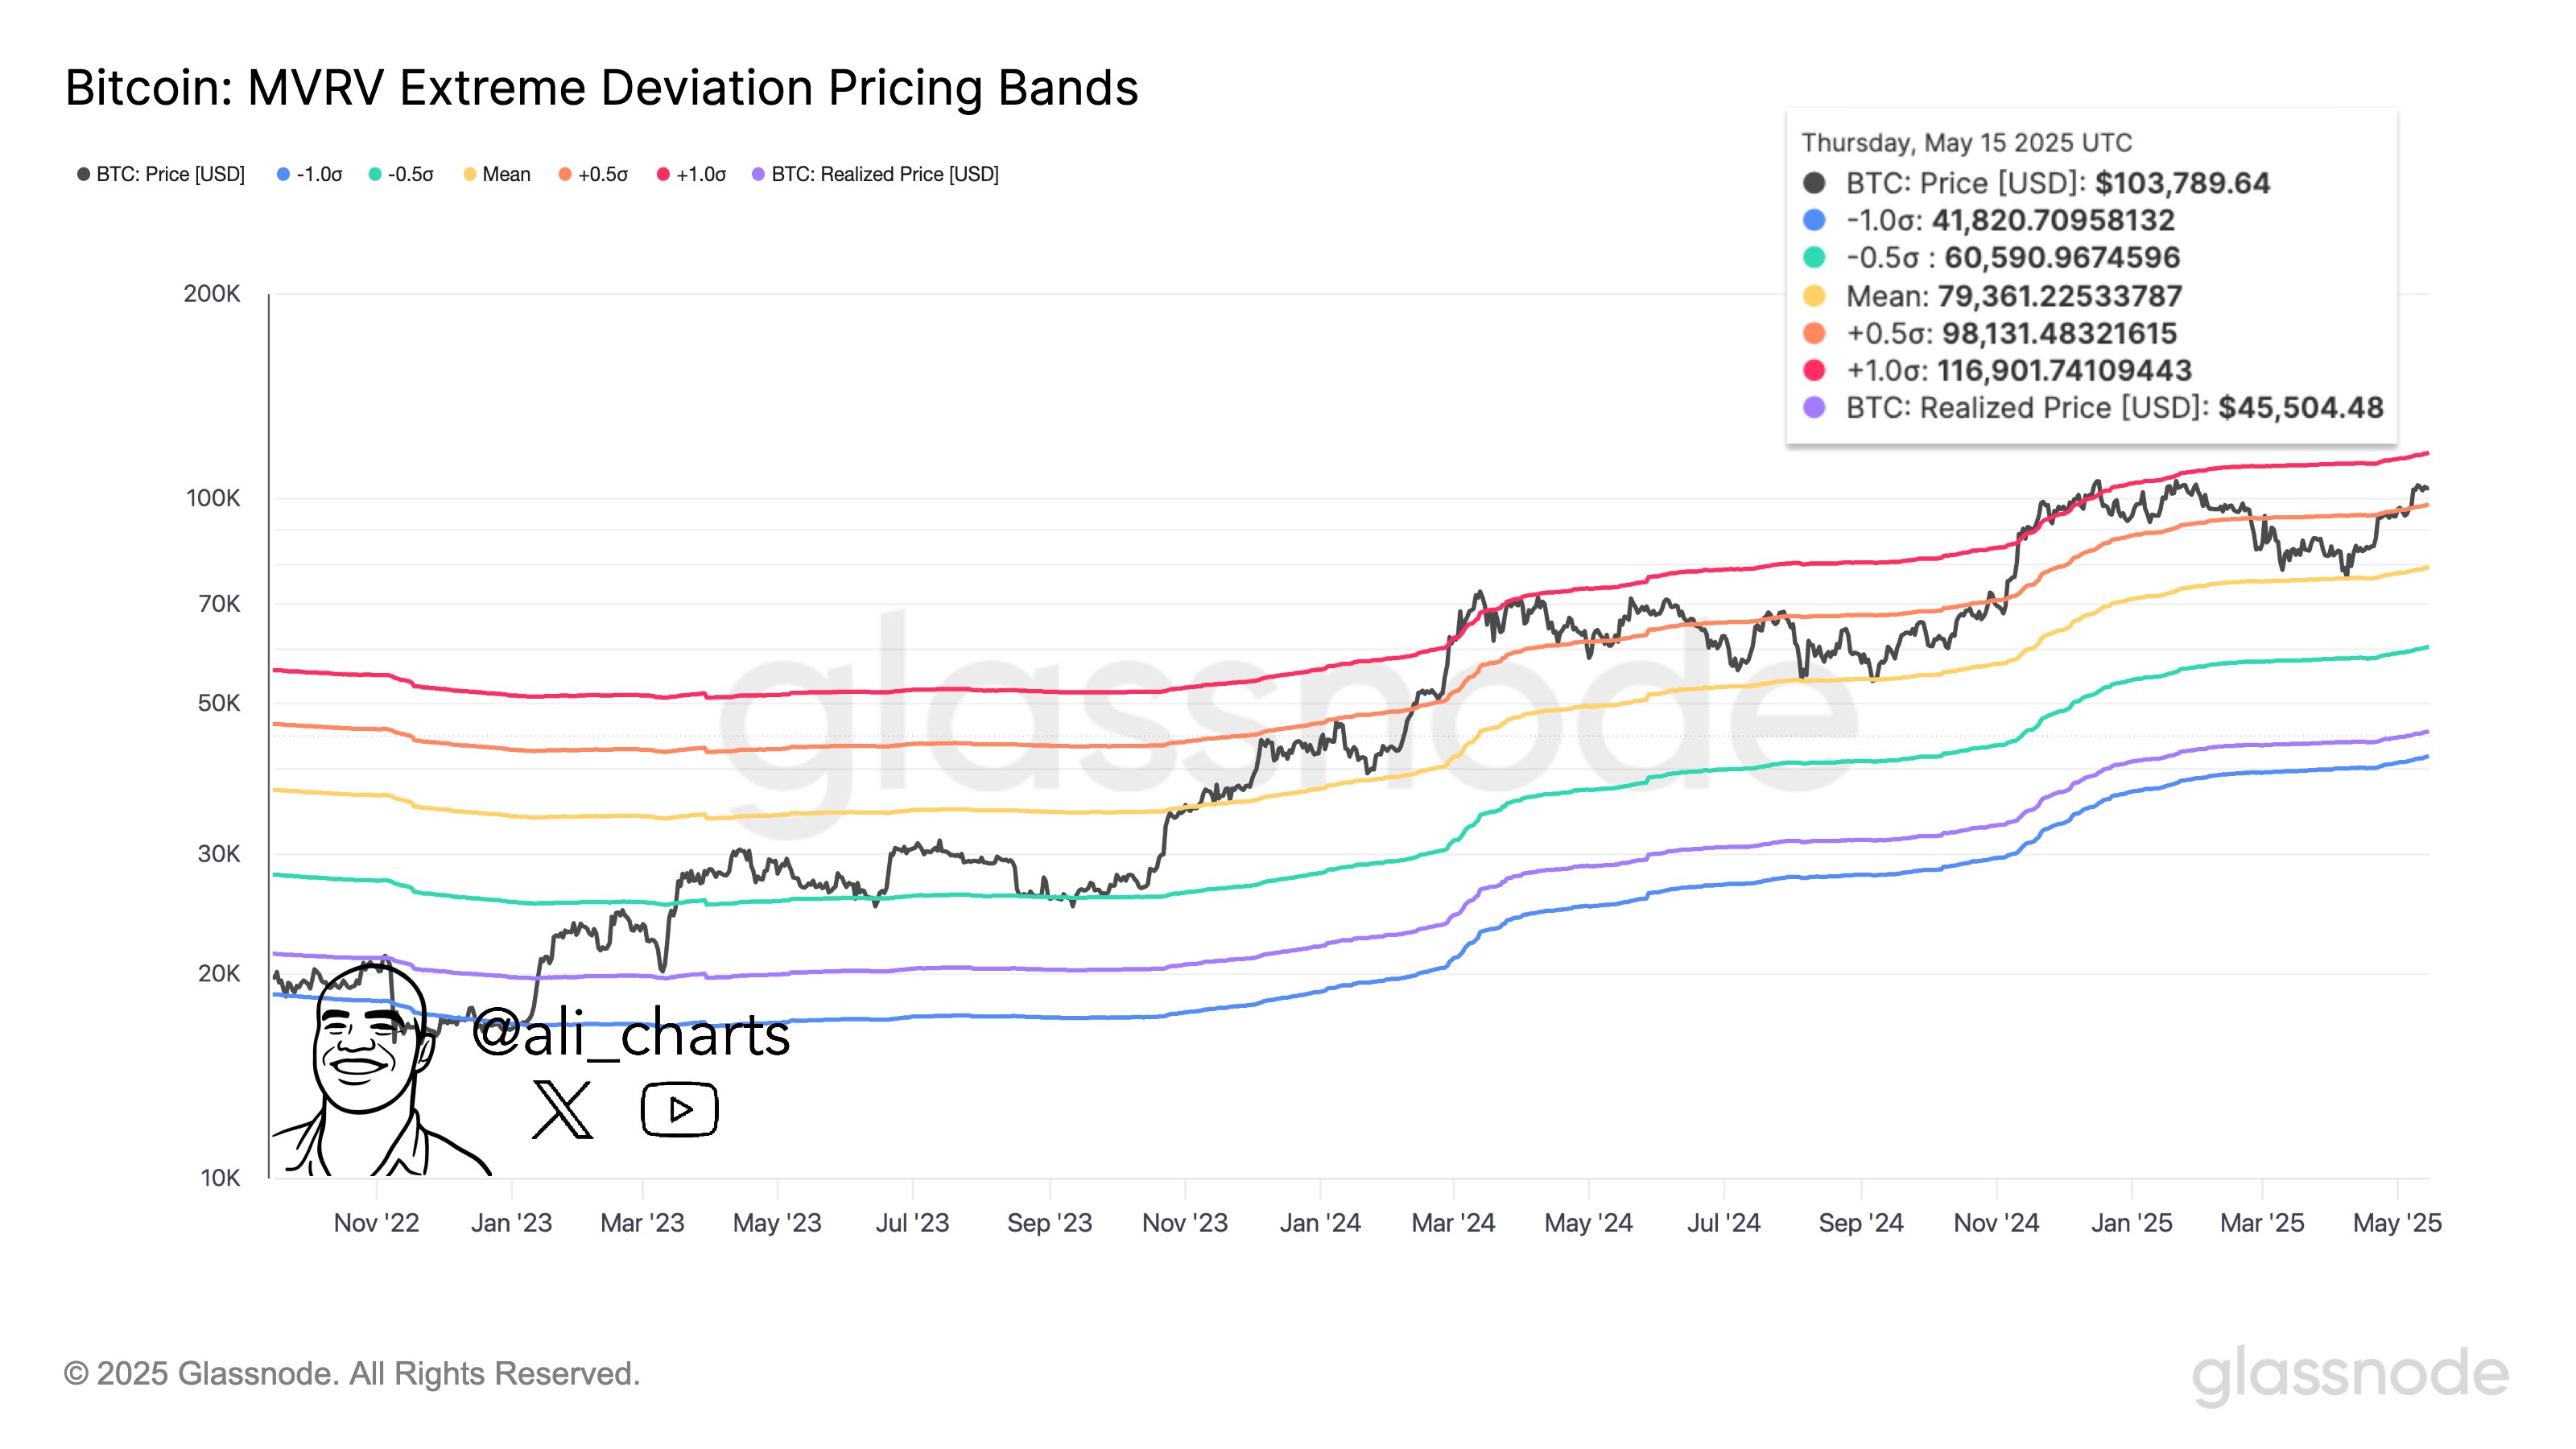
On the other hand, the premier cryptocurrency’s immediate support is around $98,131, represented by the 0.5σ MVRV band. A sustained price action above this level would indicate that bitcoin remains in a bullish valuation zone. On the other hand, a price break below this level would suggest cooling momentum or open the door to deeper retracements. Meanwhile, the mean MVRV band stands at $79,361 and serves as a fair value anchor. If BTC prices fall to this level, it would present the ideal accumulation opportunity for a potential market rebound. However, price falls to lower MVRV bands at -0.5σ ($60,590) and -1σ ($41,820) would indicate bearish retracements and cycle bottoms, respectively.
Bitcoin Holders Sit On 120% Unrealized Gains
In other news, Martinez’s MVRV pricing bands chart also shows that Bitcoin’s realized price currently stands at $45,504. With the current market price, this data suggests that the average BTC investor is sitting on significant unrealized gains potential as high as 120%. At the time of writing, Bitcoin trades at $103,529 following a 0.87% decline in the last 24 hours and 0.10% in the past week amidst the ongoing market consolidation. However, the premier cryptocurrency is up by 22.62% in the past week as bullish forces remain dominant. Presently, Bitcoin’s next resistance lies at the $105,000, a convincing price close above which could spur a further rise to the current all-time high around $109,000. If BTC successfully breaks through both resistance levels, it WOULD enter price discovery territory, potentially accelerating gains toward the projected target around $117,000.
