Bitcoin Spread Oscillator Flashes Green: Altcoins Primed for Takeoff?

Bitcoin’s dominance wobbles as the spread oscillator hints at altcoin momentum—just in time for traders to rotate profits from BTC’s sluggish price action.
Market pulse: The ’altseason’ alarm bells are ringing, but will retail investors wake up before Wall Street’s algo-traders front-run the rally? History suggests they won’t.
Cynical footnote: Nothing unites crypto bros faster than the hope of dumping their shitcoin bags on greater fools.
Altcoin Oscillator Signals Building Momentum As Bitcoin Approaches ATH
Bitcoin has gained over 12% in the past week and more than 40% since its April 9th low, confirming a sustained five-week uptrend that reflects growing investor confidence. This rally marks a key shift in market sentiment after months of volatility and uncertainty. With BTC now trading just below its all-time high NEAR $109K, bulls are in control—but the real test lies ahead.
The coming weeks are expected to be decisive. Some analysts anticipate a clean breakout above the previous high, which WOULD confirm a continuation of the broader bull cycle. Others argue that current levels may trigger profit-taking and a potential short-term correction. Either way, momentum remains strong, and Bitcoin’s ability to hold above $100K will be crucial.
At the same time, market dynamics are shifting. Top analyst Axel Adler points to the Bitcoin Market Performance & Altcoin Spread indicator—a composite oscillator that tracks how altcoins like ethereum and Solana perform relative to BTC. According to Adler, this metric recently hit 38%. Historically, once the 30-day moving average of the oscillator crosses 50%, it signals the beginning of an altseason.
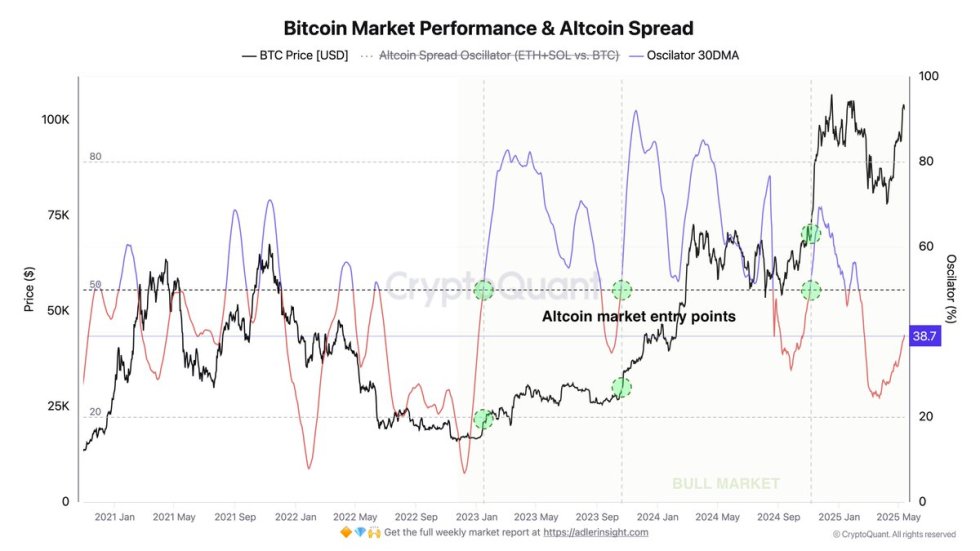
With just 12 percentage points remaining before the signal confirms, capital rotation from Bitcoin to altcoins could be imminent. Green dots on the oscillator indicate these historical inflection points. If this trend continues and altcoins begin to outperform, it would confirm a broader risk-on environment across crypto.
BTC Weekly Chart Analysis: Resistance Holds for Now
The weekly chart for Bitcoin shows that the price is currently consolidating just below the all-time high zone after failing to break cleanly above it. BTC reached a high of $105,706 before pulling back and closing the weekly candle around $103,850. This level marks a critical resistance area, historically significant from January’s peak, and now acting as a short-term ceiling for bullish continuation.
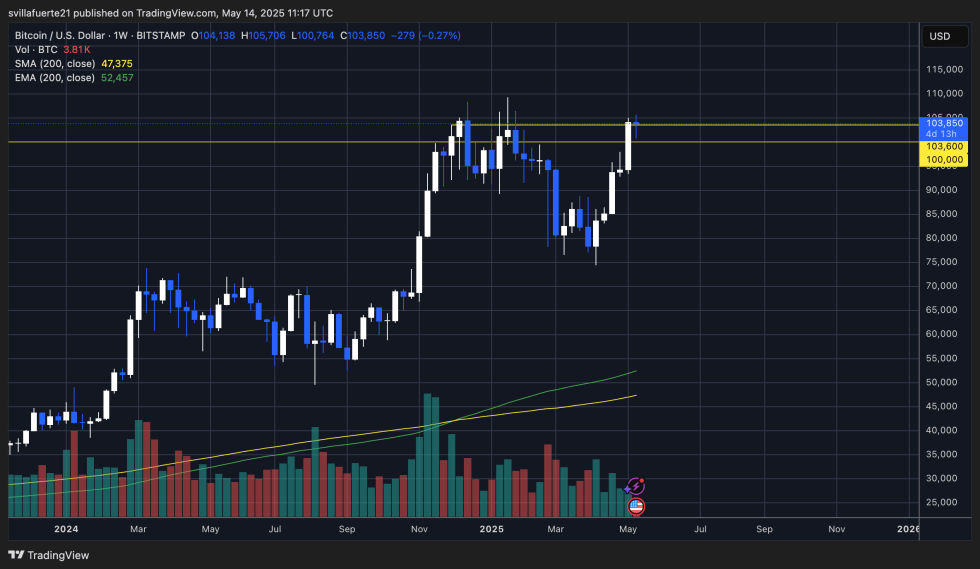
Despite the rejection from highs, the structure remains bullish. BTC is holding well above the psychological $100,000 level and key moving averages. The 200-week SMA sits far below at $47,375, and the 200-week EMA at $52,457, both indicating a strong long-term uptrend is intact.
Volume over recent weeks confirms rising participation, supporting the idea of growing interest as Bitcoin approaches price discovery once again. The key now is whether bulls can reclaim the $105K level on a weekly closing basis, which would open the door for a breakout toward $109K and beyond.
If the price fails to hold above $100K in the coming sessions, a deeper retrace could test lower support zones around $96K–$94K. Still, the momentum is bullish, and the weekly close above $103K keeps the rally alive.
Featured image from Dall-E, chart from TradingView
