Bitcoin’s Bull-Bear Indicator Just Triggered Its First Buy Signal in 15 Months – Here’s Why It Matters

After 15 months of hibernation, Bitcoin’s bull-bear cycle indicator just roared back to life with its first bullish signal since February 2024. The timing couldn’t be more poetic – just as Wall Street ’experts’ start writing crypto obituaries again.
What’s flashing green? The same on-chain metric that predicted every major BTC rally since 2020 just cut through the noise. No fancy jargon, no hedge fund spin – just cold, hard blockchain data screaming ’accumulate.’
Remember: These signals don’t guarantee moon missions. But when this indicator last turned bullish? Bitcoin ripped 300% in 12 months. Cue the institutional FOMO in 3...2...
Bitcoin Eyes Continuation As Key Indicator Flashes Early Bullish Signal
Bitcoin is preparing to test uncharted territory after months of heavy selling pressure, negative sentiment, and persistent macro uncertainty. Following a strong rally that pushed the price above $100,000, BTC is now finding resistance NEAR the $104,000 level—a key supply zone that could act as a short-term ceiling. Bulls are firmly in control, but the market remains cautious as this level represents the final major hurdle before a potential breakout toward the $109,000 all-time high.
Breaking above $104,000 would likely trigger significant momentum, pushing prices into price discovery and unleashing a new wave of investor optimism. However, this area could also invite increased profit-taking and fresh sell-side pressure. Whether Bitcoin can sustain this rally will depend on broader market dynamics and investor conviction at these highs.
According to CryptoQuant, there’s reason to believe the tide is shifting. Since February 24, 2024, the platform’s Bull Bear Market Cycle indicator has consistently signaled bearish conditions.
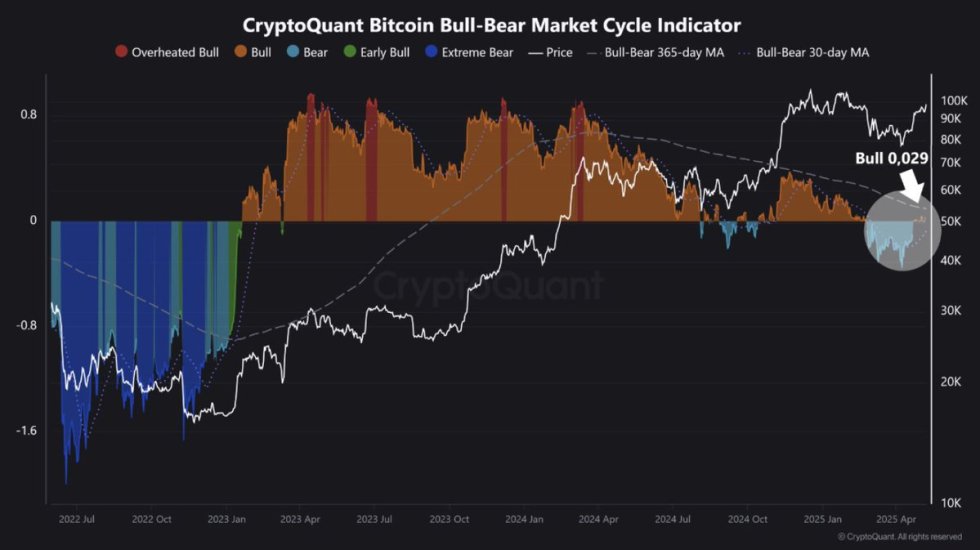
Yet, in recent days, this signal has started to flip. Although the current bullish coefficient remains weak at 0.029, it marks the first positive reading in weeks. More importantly, the Bull-Bear 30DMA, a short-term trend signal, has begun to turn upward. If it crosses above the longer-term 365DMA, historical data suggests that bitcoin could enter a parabolic rally phase similar to past bull cycles.
This confluence of price action and on-chain momentum points to a critical juncture. If the structure holds and indicators align, Bitcoin may be on the verge of rewriting history once again.
Price Consolidates After Explosive Rally
Bitcoin is currently consolidating just below the $103,600 resistance level after a powerful rally that pushed the price from below $90,000 to over $103,000 in a matter of days. As shown on the 4-hour chart, BTC has printed a tight bullish flag right below a key supply zone, suggesting continuation potential if momentum holds. The 200-period SMA ($89,946) and EMA ($92,357) are both trending upward, further confirming the strength of the underlying uptrend and offering strong support in case of a pullback.
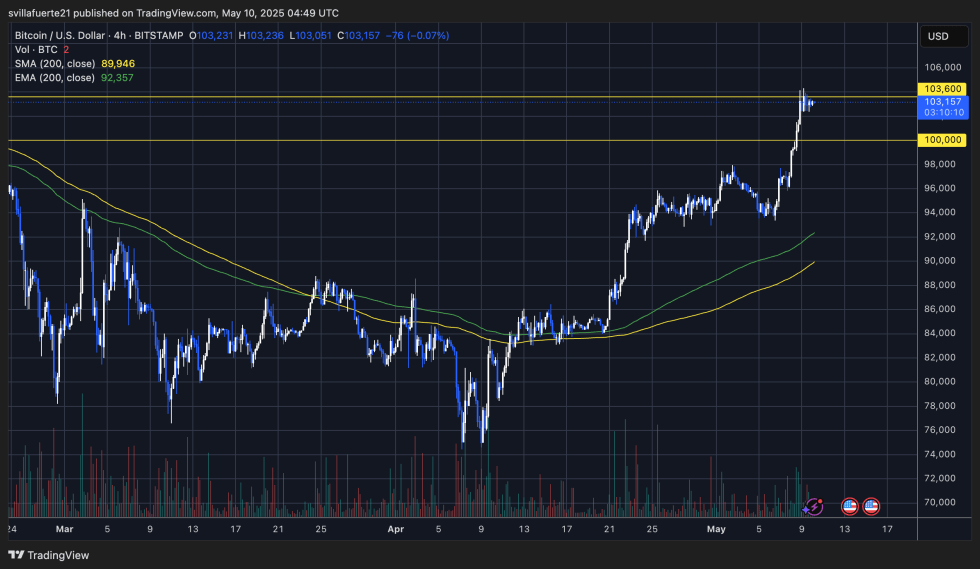
Volume has slightly decreased during this consolidation phase, which is typical of a bullish structure where buyers pause before attempting a breakout. A sustained close above $103,600 could quickly send Bitcoin toward the all-time high zone around $109,000. However, failure to break this resistance could lead to short-term profit-taking and a retest of the $100,000 level as psychological support.
Overall, the price structure remains very constructive, and the recent clean break above the previous range between $92K–$98K adds weight to the bullish thesis. Bulls are in control for now, but the next few sessions will determine whether this momentum leads to price discovery or a short-term cool-down.
Featured image from Dall-E, chart from TradingView

Log in to Reply
Log in to comment your thoughtsComments
Related Articles
|Square
Get the BTCC app to start your crypto journey
Get started today Scan to join our 100M+ users