Ethereum Shatters Multi-Year Downtrend Against Bitcoin – Is the Tide Turning?

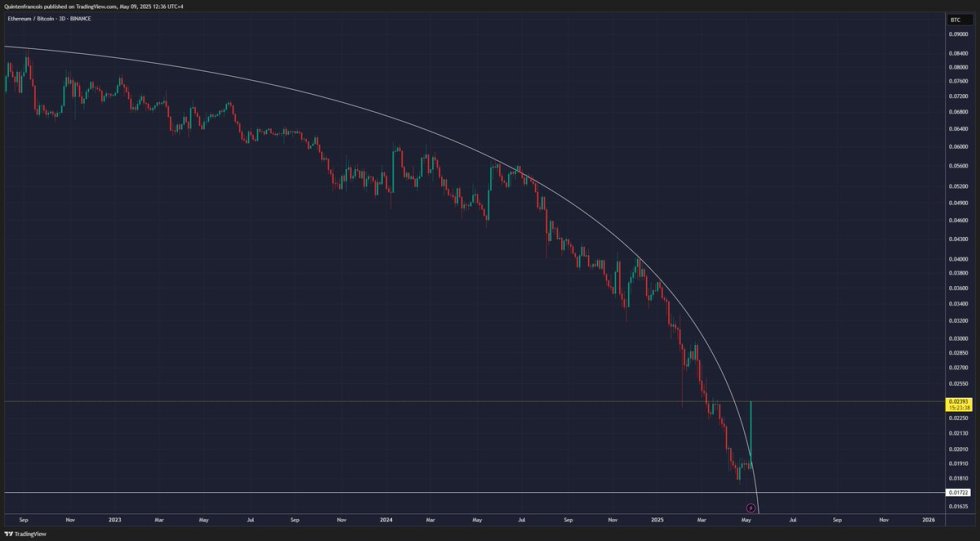
After years of playing second fiddle to Bitcoin, Ethereum just ripped through a stubborn downward trendline on the ETH/BTC chart. Traders are scrambling—is this the long-awaited flippening precursor, or just another fakeout to lure in overleveraged degens?
The breakout comes as Ethereum’s ecosystem quietly absorbs institutional interest (despite Wall Street still pretending NFTs were just monkey jpegs). Layer-2 activity hits record highs while Bitcoin maximalists cope by resharing their 2017 ’ETH is a scam’ tweets.
One thing’s certain: if this holds, the crypto casino’s power dynamics just got a lot more interesting. Just don’t ask your bank’s financial advisor about it—they’re still trying to explain what a blockchain is.
Ethereum Breaks Multiple Supply Levels And Tests Key Resistance
After an explosive rally that pushed ethereum above key resistance at $1,850 and up to a high of $2,490, ETH is now stabilizing as bulls secure support near the $2,500 mark. This level has quickly become a critical demand zone, and its defense over the weekend could determine whether Ethereum continues its momentum or pulls back for consolidation. With Bitcoin hovering around its all-time high, the spotlight has shifted to altcoins, and Ethereum is leading the charge.
For the first time in years, ETH appears to be forming a strong bullish structure following months of relentless selling pressure and bearish sentiment. The recent price surge marks a significant shift in market tone, as both technicals and fundamentals begin to align. Notably, Francois pointed out that the long-term ETH/BTC downwards parabola, in place since December 2021, is finally breaking—an event that historically precedes major altcoin rallies.
Adding to the bullish narrative is Ethereum’s upcoming Pectra update, which aims to improve efficiency, optimize staking infrastructure, and streamline network upgrades. This development is renewing investor confidence, positioning ETH as a frontrunner in the next market phase.
If Ethereum holds its ground at the $2,500 level and Bitcoin continues consolidating near its highs, the conditions are in place for Ethereum to launch a fresh bullish phase. Traders will be closely watching how ETH performs over the weekend, as sustained strength could signal the beginning of a powerful altseason. With structural resistance broken, macro sentiment shifting, and fundamental upgrades underway, Ethereum may finally be ready to lead the market into its next leg higher.
ETH Price Breakout: Buying Pressure Sets Direction
Ethereum’s recent price action shows a dramatic breakout, with ETH surging from around $1,800 to a high of $2,352 in just a few sessions. This 4-hour chart highlights the strength of the move, which came with an explosive increase in volume and a steep bullish candle structure—clearly breaking above both the 200-day SMA and EMA, currently sitting NEAR $1,716 and $1,821, respectively. These moving averages now act as strong dynamic support zones.
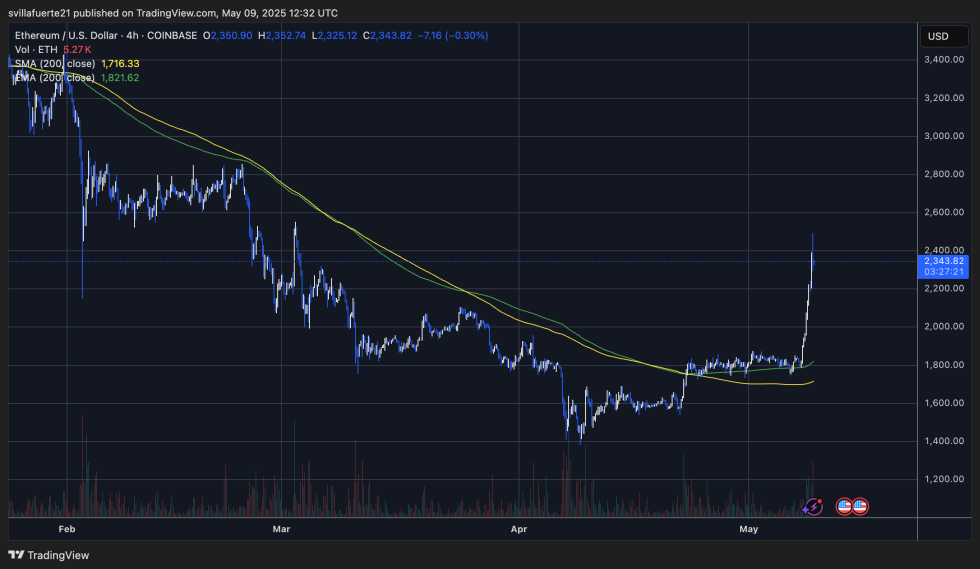
Price is currently consolidating just above $2,340, suggesting that bulls are holding the gains and attempting to FORM a base above this psychological level. This pause could allow Ethereum to build momentum for a push toward the next resistance range around $2,500, which aligns with the previous local highs seen in early January.
Importantly, this breakout comes after months of sideways movement and a prolonged downtrend. The steep slope of the upward MOVE reflects a shift in market structure, as bears get squeezed and momentum flows into ETH. If bulls maintain control and the price stays above $2,200 in the short term, a continuation higher is likely. However, if the price breaks back below $2,200 with volume, we could see a retracement toward the $2,000–$2,100 range before resuming higher.
Featured image from Dall-E, chart from TradingView

Log in to Reply
Log in to comment your thoughtsComments
Related Articles
|Square
Get the BTCC app to start your crypto journey
Get started today Scan to join our 100M+ users