Bitcoin Teeters at Short-Term Holder Break-Even – Is $132K the Next Stop?

Bitcoin’s price hovers at a critical juncture—the average cost basis for short-term holders. This level has historically acted as both springboard and trapdoor.
Market psychology in play: When BTC holds above this line, it fuels FOMO. When it cracks, panic selling follows. Right now, the bulls are betting on a repeat of 2021’s parabolic run.
Technical signals suggest a breakout could send BTC soaring toward $132K. But let’s not ignore the elephant in the room—Wall Street’s ’risk-on’ mood depends more on Fed whims than actual adoption. One dovish comment and suddenly every hedge fund manager becomes a ’long-term HODLer.’
Bitcoin Builds Momentum As Buyers Guard Key Support Level
Bitcoin has surged over 15% in less than three weeks, regaining strength after a prolonged period of volatility and consolidation. The recent move has pushed BTC just below the highly anticipated $100,000 level, with price tapping $97,900 before facing temporary resistance. Market sentiment has shifted decisively in favor of bulls, with many analysts pointing to continued momentum and a potential breakout that could shape the next leg of the bull cycle.
Top analyst Ali Martinez shared on-chain insights highlighting the importance of the Short-Term Holder Cost Basis, which currently sits at $93,460. This level represents the average acquisition price of recent market entrants and is seen as a crucial line of defense. As long as Bitcoin holds above this threshold, the structure remains bullish. Martinez suggests that maintaining this support could ignite a rally toward $132,330, following a pattern seen in previous bull markets when short-term holders remained in profit.
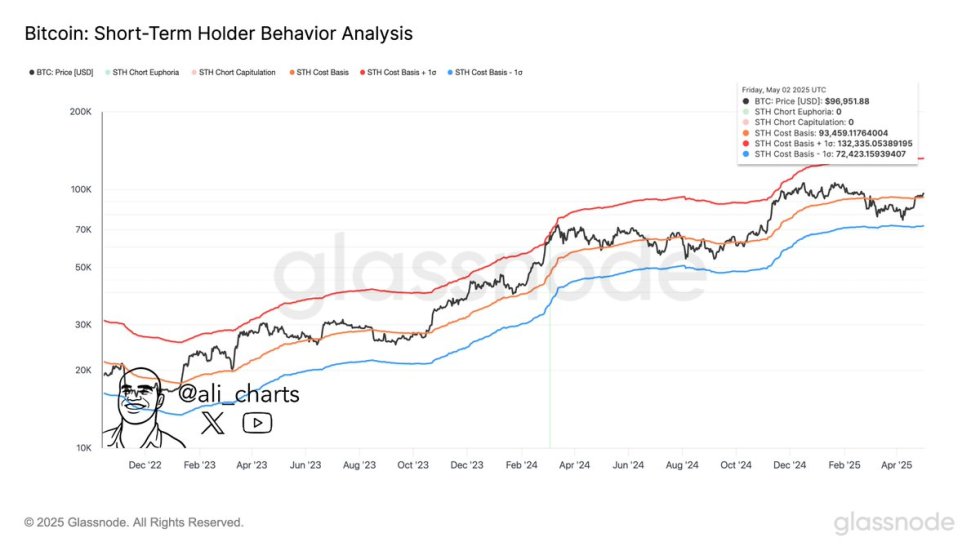
However, the bullish scenario comes with caution. A drop below the $93,460 level could signal weakening demand, triggering a potential correction toward $72,420 — a move that would test deeper liquidity zones and shake out speculative positions. For now, though, the path of least resistance appears upward. With the broader market heating up and bullish catalysts aligning, Bitcoin’s current structure suggests that the rally may be far from over.
BTC Price Analysis: Resistance Below $100K
Bitcoin is trading at $95,856 after reaching a local high NEAR $97,900, showing signs of slowing momentum just below the psychological $100K level. As seen on the daily chart, BTC has been in a strong uptrend since mid-April, reclaiming both the 200-day EMA and SMA, which now sit around $86,200 and $90,200, respectively. These moving averages now serve as key dynamic support levels.
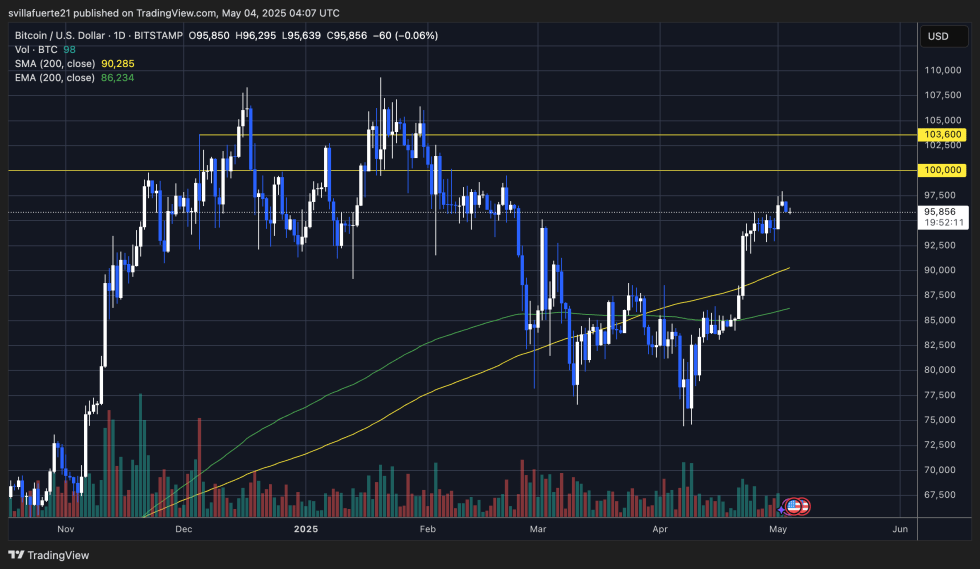
The chart reveals a clear rejection around the $100K resistance zone, which aligns with historical supply pressure from previous highs. Despite that, the price remains in a healthy consolidation just below resistance, signaling that bulls are not yet ready to give up control. Volume has slightly decreased, suggesting a pause or potential pullback, but the lack of heavy selling is a sign of strength.
If bulls manage to reclaim $97,900 and flip $100K into support, the next target is around $103,600. However, failure to break this level could trigger a short-term retracement toward the $93,000–$90,000 region. Holding above $93,460, which aligns with the short-term holder cost basis, remains critical to avoid further downside.
Featured image from Dall-E, chart from TradingView

Log in to Reply
Log in to comment your thoughtsComments
Related Articles
|Square
Get the BTCC app to start your crypto journey
Get started today Scan to join our 100M+ users