Bitcoin’s SOTT Indicator Just Lit Up – Are We Heading for a New All-Time High?

Bitcoin’s latest signal has traders buzzing—the SOTT indicator just flipped bullish. But does this actually mean a breakout is coming, or is it another false alarm for crypto’s favorite rollercoaster asset?
One analyst breaks it down: ’When SOTT turns green, history suggests momentum builds. But let’s not pretend Wall Street won’t find a way to screw retail investors anyway.’
Key factors to watch: ETF inflows, miner activity, and whether the Fed finally admits they’re out of touch with modern finance. Buckle up.
Bitcoin SOTT Indicator Turns Green, More Upside Ahead?
In a post on X today, crypto analyst Titan of Crypto noted that Bitcoin’s State of the Trend (SOTT) indicator has turned green on the weekly chart. This shift to green indicates a bullish change in BTC’s momentum.
For instance, BTC experienced significant gains the last two times its SOTT indicator turned green on the weekly chart. From October 2023 to March 2024, the cryptocurrency saw an increase of 172%, while from September 2024 to January 2025, BTC posted a 92% gain.
To explain, the SOTT indicator is a momentum-based tool that measures the strength and direction of a trend by analyzing price movements over time. When it turns green, it typically signals a strengthening bullish trend, suggesting potential upside for the asset.
While the full extent of the gains from the SOTT indicator’s green signal in April 2025 remains uncertain, projections suggest that BTC could surge as high as $130,000. Currently, BTC’s ATH stands at $108,786, according to data from CoinGecko.
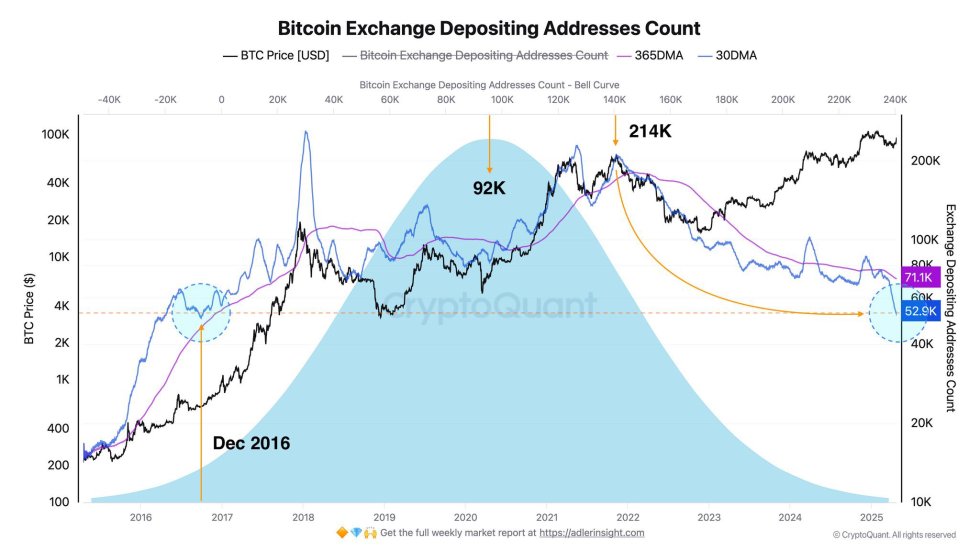
Additionally, market activity shows a decline in BTC selling pressure. According to a recent post by crypto analyst Master of Crypto, the number of addresses sending BTC to exchanges has fallen to a 30-day average of 52,000, compared to 71,000 over the past year. The analyst added:
For context, the 10-year norm sits around 92,000. We’re back to 2016-style activity. That’s a big shift. It means fewer coins hitting the market down 4x since 2022. More people are choosing to hold. Less selling = stronger price floor.
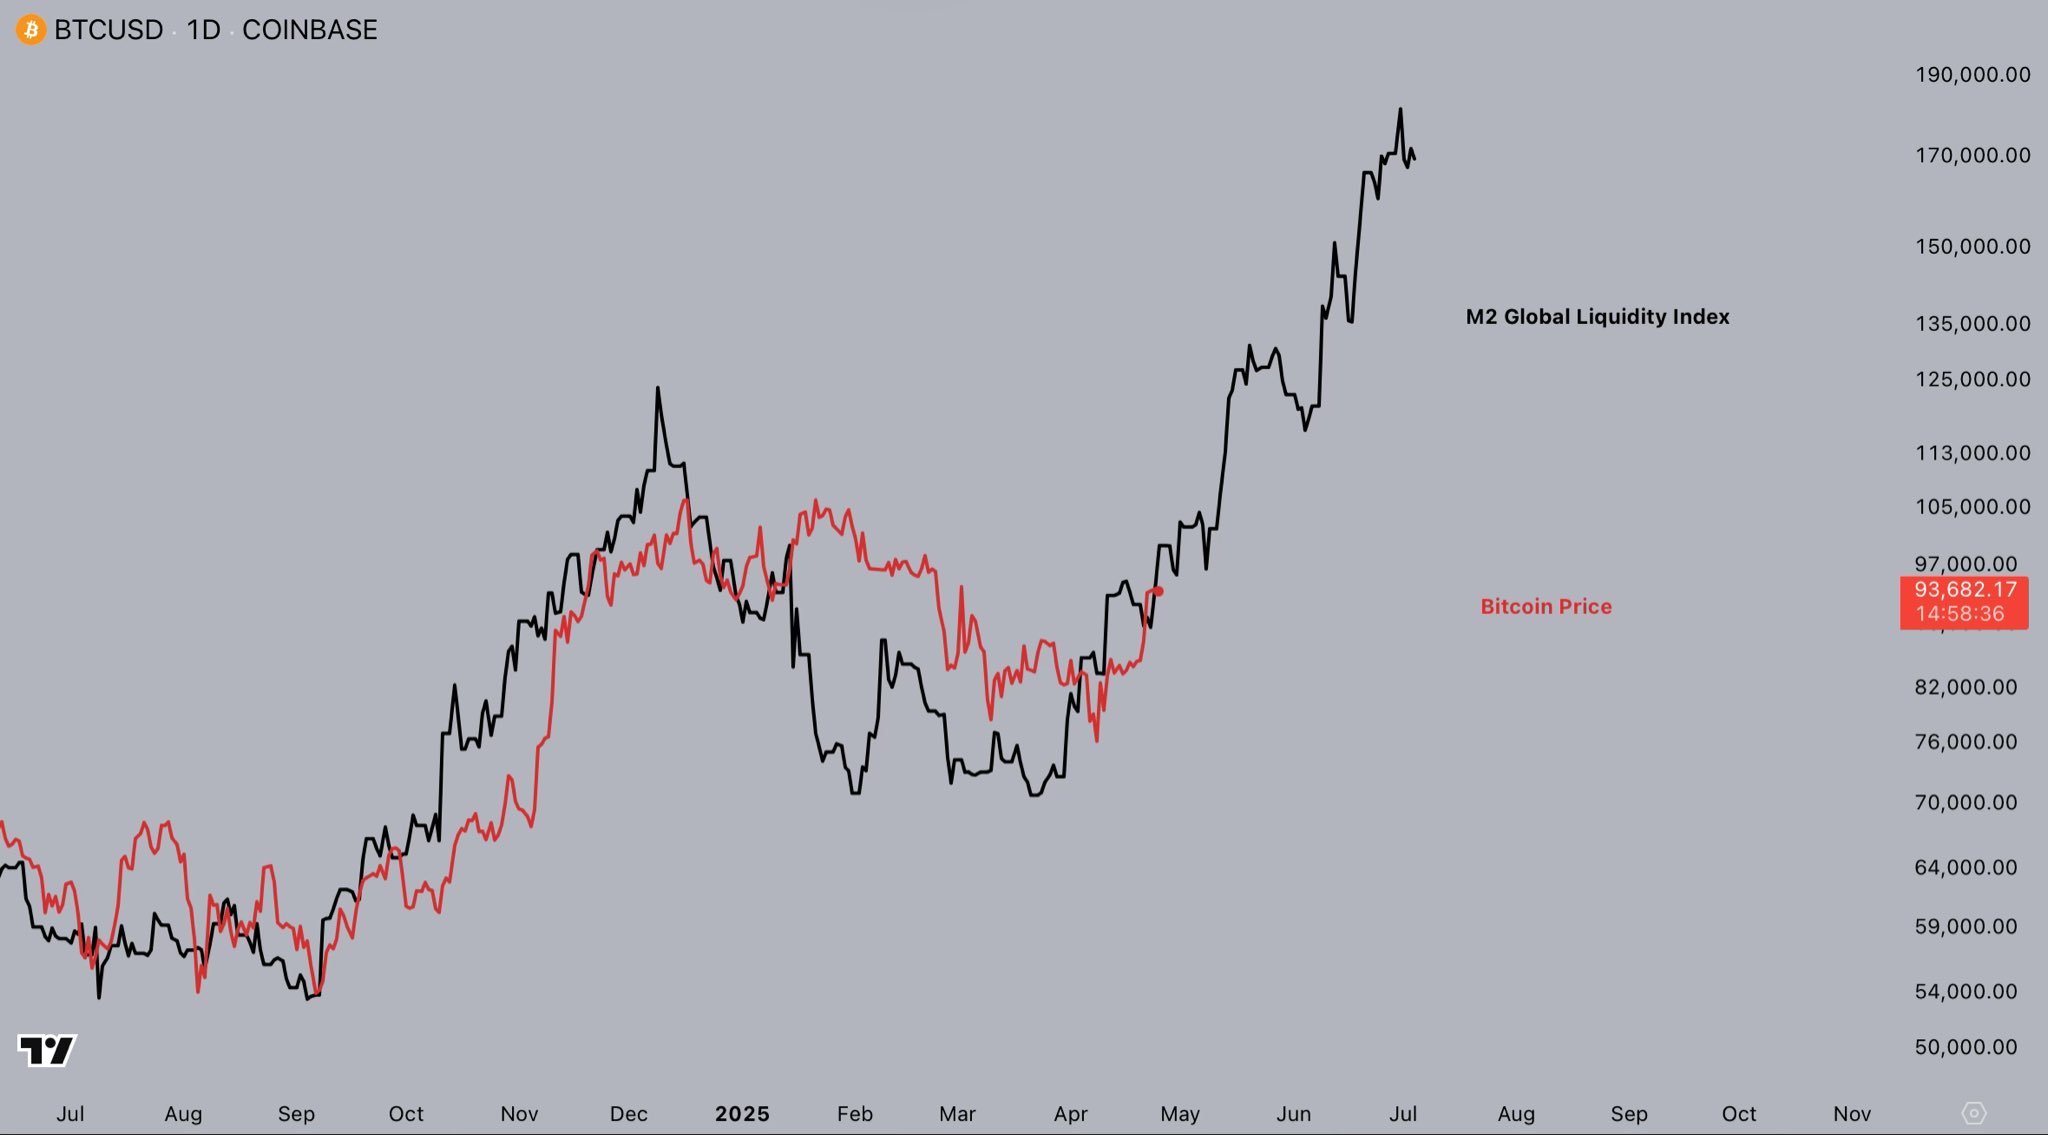
Meanwhile, favorable macroeconomic developments, such as an increase in the global M2 money supply, could also benefit BTC. Crypto analyst Jelle shared the following daily chart illustrating how BTC’s price tends to lag behind movements in the M2 money supply.
Analysts Forecast Ambitious BTC Price Targets
Technical indicators, such as Fibonacci extension levels, point toward Bitcoin potentially reaching as high as $135,000 by August 2025. However, for this upward trajectory to continue, BTC must maintain its current price level and avoid dropping below $93,500.
Further, some analysts suggest that BTC may soon mirror gold’s historic price action, with estimates predicting that the ‘digital gold’ could surge to as high as $450,000 by the end of the year. At press time, BTC is trading at $95,374, up 2.4% in the last 24 hours.

