The Single Most Crucial Bitcoin Variable Every Investor Must Master

Forget the noise. One metric cuts through the market's chaos and reveals Bitcoin's true trajectory.
The Halving Clock: Your Ultimate Market Compass
It's not the Fed, not an ETF flow, not even Elon's latest tweet. The most powerful force acting on Bitcoin's price remains its own pre-programmed scarcity mechanism. Every four years, the block reward for miners gets slashed in half—new supply gets choked off right on schedule.
Why This One Rule Beats Everything Else
Traditional finance obsesses over quarterly reports and CEO sentiment. Crypto has a simpler, harder truth: code is law. The halving is an immutable event written into Bitcoin's genesis. It bypasses central bank printers, geopolitical drama, and Wall Street's quarterly panic cycles. Past halvings have ignited the most explosive bull runs in the asset's history—not a coincidence, but a direct consequence of shock therapy to new supply.
Navigating the Post-Halving Landscape
Post-2026, the game changes. With each halving, the shock to the system diminishes in percentage terms, but the market's maturity amplifies its impact. The real play isn't just buying before the event—it's understanding the new equilibrium. Mining economics get upended, hash rate shakes out, and only the most efficient operations survive. This Darwinian pressure secures the network while setting the stage for the next valuation leap.
The Investor's Edge
Stop trying to day-trade the news. Align your timeline with the one variable that cannot be manipulated, delayed, or faked. The halving is the metronome for the entire crypto symphony—everything else is just noise. While fund managers scramble to justify their fees with overcomplicated models, you can anchor your strategy to a simple, predictable, and profoundly powerful catalyst. Sometimes, the most sophisticated move is recognizing the one rule that makes all the others irrelevant.
Why Time Inside A Bitcoin Range Matters
The analyst explained on X that the length of time Bitcoin spends trading sideways reflects how supply and demand interact at that level. Instead of focusing only on distance traveled, he emphasized that the market’s ability—or inability—to resolve a range quickly can signal the underlying strength of buyers or the pressure applied by sellers.
To illustrate this approach, he highlighted two consolidation phases on the daily BTC/USD chart. The first structure formed after a sharp decline, lasted 55 days, and covered about 21% before breaking lower. The second, active as of February 26, 2026, spans roughly 20% but has developed in only 22 days. Although their percentage width is almost identical, their timelines differ dramatically.
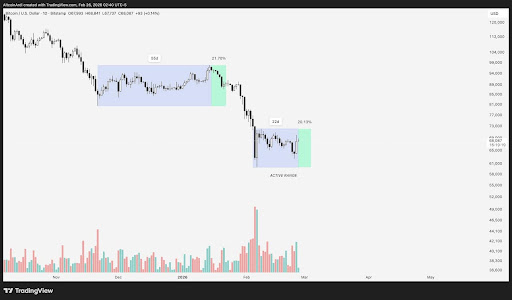
The prolonged 55-day range shows buyers actively absorbing supply for nearly two months, slowing the decline and forcing the market to work through significant demand before sellers finally regained control. In this framework, a range’s vertical height reflects the price distance required for redistribution, while its horizontal duration captures how long that redistribution takes. A long-lasting structure implies sustained contention between both sides; a short-lived one points to imbalance.
This makes the current 22-day range especially important. It has already reached a similar depth in less than half the time. If it breaks lower soon, it WOULD signal that sellers now overpower buyers much more quickly at comparable price levels—an indication of fading demand during the broader downtrend.
What The Current Structure Suggests
The chart reinforces this time-driven interpretation. The initial consolidation expanded gradually before its decisive breakdown, reflecting a slow and steady absorption of buying pressure. The current formation emerged after another sharp decline but is unfolding far more rapidly within a similar percentage band.
Duration becomes the deciding factor from here. A swift downward resolution would confirm that buyer resistance has weakened relative to the earlier range. Achieving a similar structural outcome in fewer days would show reduced demand at this stage of the decline. Alternatively, if Bitcoin holds the range longer than expected or breaks upward with conviction, it would indicate renewed buyer engagement and potential accumulation. In that case, the zone could develop into meaningful support on future retests.
This perspective reframes common market-structure analysis. Price levels attract attention, but the time spent within them often reveals more about shifting conviction. In the current downtrend, the duration of Bitcoin’s consolidation may offer the clearest insight into which side is preparing to take control next.
