Bitcoin’s Bearish Pivot Echoes 2022’s LUNA Collapse – Is This the Most Severe Decay Yet?

Bitcoin's recent downturn isn't just a dip—it's a structural shift. The flagship cryptocurrency's decay pattern mirrors the severity of the 2022 LUNA collapse, sparking debates about whether this is a temporary correction or a prolonged bearish pivot.
The Technical Breakdown
Charts don't lie. The current price action shows a breakdown in key support levels that hasn't been witnessed since Terra's ecosystem imploded. Trading volumes suggest institutional hesitation, while retail sentiment swings between panic and opportunistic accumulation.
Market Mechanics at Play
Liquidity is thinning faster than a hedge fund's patience during a drawdown. The usual buy-the-dip crowd appears sidelined, waiting for clearer signals. Meanwhile, derivatives markets show increased hedging activity—smart money preparing for volatility, not necessarily collapse.
Regulatory Shadows Lengthen
Global regulators haven't forgotten 2022's lessons. Watchdogs from the FSA to the SEC are scrutinizing crypto markets with renewed vigor, creating headwinds that didn't exist during previous cycles. Compliance costs are rising while innovation faces increased friction.
The Silver Lining Narrative
Every bear market births the next bull run. Infrastructure development continues behind the scenes—layer-2 solutions mature, institutional custody solutions expand, and real-world adoption metrics quietly advance. The technology evolves even when prices stagnate.
Remember: Wall Street sells shovels during gold rushes and tissues during crashes—their business model adapts either way. Bitcoin's fundamentals remain intact despite price action suggesting otherwise. This might just be the washout needed for sustainable growth.
Bearish Confluence Signals Echo Prior Cycle Dynamics
The report highlights that the last comparable bearish confluence following an all-time high occurred in May 2022, a period that ultimately preceded a prolonged corrective phase. According to the analysis, this comparison is based on a combination of structural indicators rather than isolated price action, specifically the BTC Growth Rate Difference between Market Cap and Realized Cap — an indicator developed by CryptoQuant CEO Ki Young Ju — alongside Anchored VWAP levels tied to the third and fourth Bitcoin halvings.

The Growth Rate Difference metric evaluates whether market capitalization expansion is outpacing the underlying realized capitalization, which reflects the aggregated cost basis of coins on-chain. When this gap narrows or turns negative, it often signals weakening speculative momentum and reduced capital inflows relative to existing holder positioning.
At the same time, Bitcoin trading below key halving-anchored AVWAP levels suggests diminished structural support from long-term cost bases. Historically, these levels have functioned as reference zones for institutional and macro-oriented investors.
Together, these indicators do not guarantee further downside, but they do indicate a fragile market structure. Such conditions typically require either renewed liquidity inflows or sustained accumulation before a convincing recovery phase can develop.
Bitcoin Price Tests Key Support As Downtrend Persists
Bitcoin’s weekly structure continues to reflect a corrective phase, with price struggling to stabilize NEAR the mid-$60,000 range after a sharp rejection from the $110,000–$120,000 zone seen late last year. The chart shows a clear transition from bullish expansion to distribution, followed by a sustained sequence of lower highs and lower lows — a pattern typically associated with weakening momentum rather than consolidation.
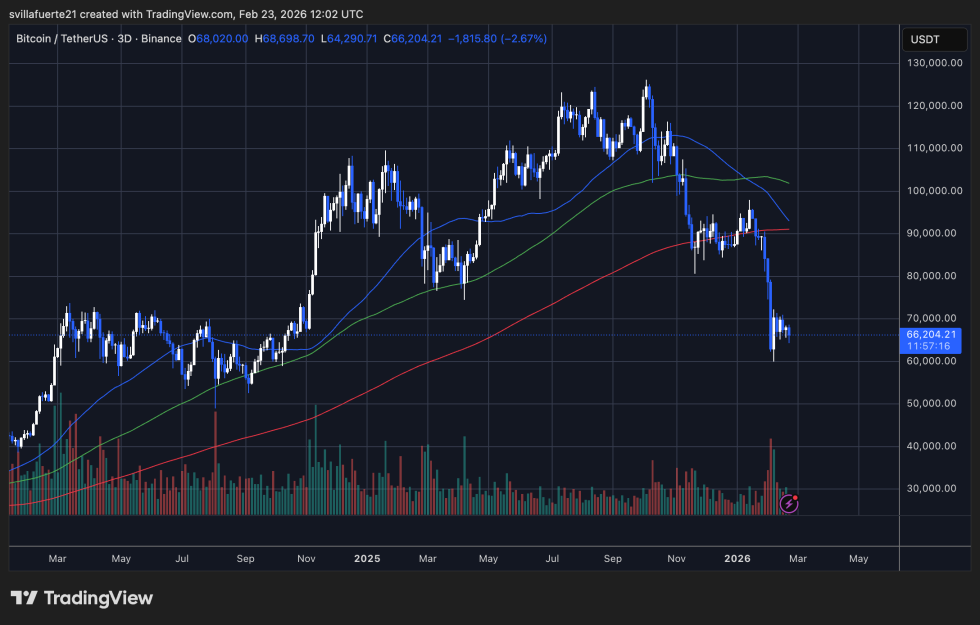
Technically, Bitcoin is now trading below major moving averages that previously acted as dynamic support. The shorter-term average has already rolled over decisively, while the longer-term trend line remains upward sloping but increasingly distant from current price action. Sustained trading beneath these levels usually reflects cautious sentiment and reduced upside conviction.
Volume spikes during recent selloffs suggest active distribution rather than passive drift lower. However, declining participation afterward could indicate partial exhaustion of aggressive sellers, potentially opening the door for a stabilization phase if demand returns.
From a structural perspective, the $60,000–$62,000 zone appears to function as immediate support, while the $70,000–$75,000 range represents the first meaningful resistance band. Unless Bitcoin decisively reclaims higher levels with strong volume, the broader trend remains fragile, with consolidation or additional downside risk still plausible.
Featured image from ChatGPT, chart from TradingView.com
