Bitcoin’s $40,000 Price Floor: On-Chain Data Signals the Bottom Is In

Forget the panic. Ignore the noise. The blockchain itself is whispering a number—$40,000—and for Bitcoin, that whisper might just be a roar.
The Ledger Doesn't Lie
While traders stare at candlestick charts and sweat over futures, a deeper story unfolds on-chain. Key metrics tracking investor behavior and network fundamentals are converging, painting a stark picture of support. It's not about sentiment; it's about cold, hard cryptographic data pointing to a major valuation anchor.
Where Paper Hands Meet Diamond Resolve
The $40,000 zone represents more than a psychological round number. On-chain analysis suggests it's the level where long-term holders dig in and short-term speculators finally capitulate. This creates a supply shock—fewer coins moving, less selling pressure. The network's foundational strength bypasses the daily drama of headlines.
A Foundation, Not a Forecast
Calling a bottom is the favorite pastime of finance gurus who'd predict rain at a desert wedding. This isn't that. This is about identifying a zone of extreme equilibrium, where asset velocity slows to a crawl and realized price models scream 'value.' It's the market finding its structural footing after the euphoria fades.
The data cuts through the fear. It suggests the speculative froth is gone, leaving a core of resilient infrastructure. Maybe the traditional finance crowd will finally look past their spreadsheets and see the utility—or maybe they'll just wait for the next ATH to call it an 'asset class.' Either way, the chain is building its case, one immutable block at a time.
Here’s Why $40,000 Could Be Pivotal To The Bear Market
In a recent post on the X platform, crypto analyst Ali Martinez identified the $40,000 level as a potential bottom for the bitcoin price in the current market phase. This projection is based on the cost basis of an old investor cohort known as the long-term holders (LTH)
For context, the cost basis of long-term holders refers to the average price at which Bitcoin investors (who have held their coins for 155 days or more) acquired their coins. This price level is often relevant because long-term investors are often referred to as diamond hands, who are less likely to sell during periods of downside volatility.
Moreover, the LTH cost basis tends to act as the ultimate support level during bear markets, as most long-term investors are usually still in profit even in the thick of the bear market. Hence, when the Bitcoin price falls to this support, the long-term holders double down on their positions.

This renewed buying activity by the long-term holders WOULD prop up the price of the premier cryptocurrency above their cost basis, as observed in the chart above. According to the highlighted data, the LTH cost basis is currently around $40,363, about 40% from the current price point.
If the Bitcoin price were to face further downside pressure and approach this cost basis, there is a likelihood it would receive support from the long-term investors’ increased reaccumulation. Hence, this cost basis could become the bottom for the current bear market.
On the flip side, the Bitcoin market could face an even deeper correction if the selling pressure overwhelms the long-term holders’ reaccumulation spree.
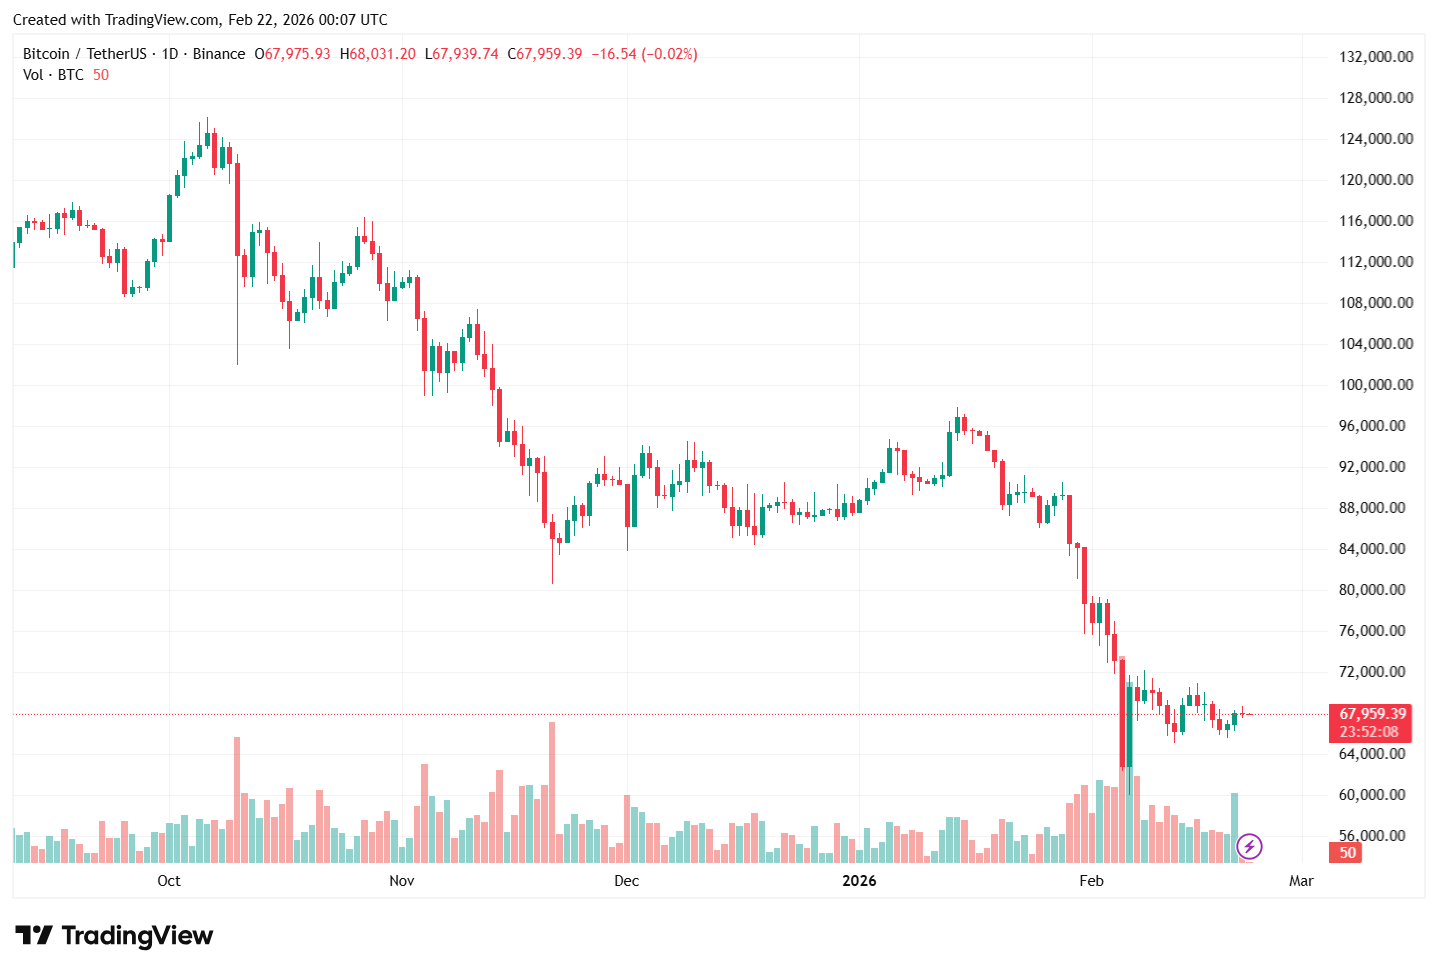
Bitcoin Price Overview
As of this writing, the price of BTC stands at around $68,330, reflecting a nearly 1% increase in the past 24 hours. However, this mild single-day action does little to correct the over 2% price decline witnessed by the premier cryptocurrency over the past week. According to data from CoinGecko, the Bitcoin price is currently down from its all-time high by more than 45%.