Key Bitcoin Metric Flashes Warning: The Downside Could Linger

Bitcoin's price action has traders on edge, and one critical on-chain signal suggests the pain isn't over yet.
### The Metric That's Telling the Tale
Forget the hourly charts and social media hype. The real story is written in the unspent transaction outputs, the dormant wallets, and the network's underlying economic activity. A specific, widely-watched indicator—often cited by institutional analysts—has rolled over. It's not signaling a crash, but it's flashing a clear yellow light for sustained downward pressure.
### What This Means for Your Portfolio
It translates to volatility. Expect chop, false breakouts, and sentiment whiplash as the market digests this technical reality. This isn't a time for heroic all-in leverage plays; it's a period for strategic accumulation or, for the active trader, nimble range-bound tactics. The 'number go up' crowd is getting a harsh lesson in market cycles—turns out, digital gold can still tarnish when the macro winds shift.
### The Silver Lining in the Data
Here's the bullish twist: these corrective phases are what build the foundation for the next leg higher. They flush out weak hands and over-leveraged positions, transferring assets to stronger, more conviction-driven holders. While the metric suggests downside persistence, history shows these resets often create the most lucrative long-term entry zones. Consider it the market's way of doing spring cleaning—messy in the moment, but everything looks better afterward. Just ask any traditional finance portfolio manager currently trying to justify their 2% annual fee while watching this unfold.
Bitcoin Metric Warns The Pullback Isn’t Over Yet
Bitcoin’s ongoing downside movement does not seem to have reached its climax yet. An indicator of the bitcoin market that is closely monitored indicates that the current dip has not ended, and the correction may continue for a short time.
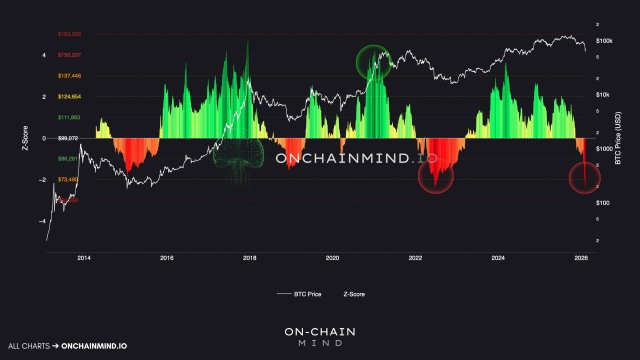
This data from the Bitcoin Z-Score metric suggests that selling pressure and weak demand conditions are highly likely to continue in the upcoming days, weeks, or even months. Following an analysis of the metric, On-Chain Mind disclosed that BTC has hit a -3σ downside deviation in the recent crash.
The -3σ downside deviation, which is sitting at the $60,000 price mark, is the most extreme statistical stretch in the history of BTC. On-Chain Mind outlined that a continued severe breakdown below this level now WOULD be historically unprecedented.
Given the data from the metric, the crypto expert predicts that the negative chop will continue for a little while longer. Interestingly, the final bottoms are created by monotonous, choppy compression and now vertical crashes. In the meantime, the possibility of a continued short-term weakness before a stronger recovery emerges remains high.
Darkfost, a market expert and author at CryptoQuant, has shed light on the current state of the BTC environment using the Bull Score Signals metric. This metric provides an overview of the market’s on-chain health and highlights multiple key elements affecting Bitcoin’s price behavior.
It further covers a variety of significant information regarding demand, liquidity, and the value of Bitcoin. Currently, the majority of these indicators are still in the red, which suggests that the environment is not improving yet. As long as this is the case, Bitcoin’s difficulty of reaching a new all-time high in the short term becomes extremely hard.
Whales Under Pressure Due To BTC’s Drop
With a temporary break below $60,000, a wave of nervousness has been ignited across the market, putting Bitcoin whales under pressure. Despite popular opinion, these big holders do not consistently constitute a type of patient and logical smart money because they react to market shocks either opportunistically or under pressure.
Examining their inflows on the Binance platform, Darkfost has highlighted an increase in the monthly time frame. The monthly inflow ROSE from around 1,000 BTC to nearly 3,000 BTC, with a notable spike of roughly 12,000 BTC on February 6 alone. When there is significant price stress, this kind of action indicates that transfers to exchanges are more intense.
Since February 1, more than 50,000 BTC inflows were observed from this group, suggesting sensitivity to rapid market swings from the investors as they adjust their positions. These investors can abruptly influence price dynamics, which can be good in gauging the forces shaping the market. In an environment where overall market liquidity is tightening, rising inflows are often a sign of increased selling pressure.
