Why This Bitcoin Bear Market Ranks Among The Worst Ever: CryptoQuant Researcher’s Stark Warning

Bitcoin's latest plunge isn't just another dip—it's carving a place in crypto infamy. According to a leading CryptoQuant researcher, the current downturn is shaping up to be one of the most brutal in the asset's volatile history.
The Anatomy of a Historic Slump
Forget the usual volatility. This cycle's metrics—from on-chain capitulation to exchange outflow patterns—paint a uniquely grim picture. The data suggests a perfect storm of macroeconomic pressure, institutional hesitation, and retail exhaustion.
When the Charts Scream 'Unprecedented'
Key indicators tracked by CryptoQuant aren't just flashing red; they're signaling a structural reset. The depth and duration of negative momentum are breaking patterns established in prior bear markets, hinting at a longer, more painful recovery road ahead.
A Cynical Finance Jab
It's the kind of market that separates diamond hands from paper portfolios—and reminds everyone that in crypto, 'long-term hold' sometimes feels less like an investment strategy and more like a hostage situation.
The Silver Lining? It's Built on Pain
True believers argue these washouts are necessary. They purge excess leverage, reset unrealistic expectations, and lay the foundation for the next parabolic run. The researcher's analysis, while stark, ultimately underscores crypto's relentless cycle: catastrophic collapse followed by unimaginable rebirth.
BTC Price Is 30% Below 365-Day Moving Average
In a new post on the social media platform X, CryptoQuant’s head of research, Julio Moreno, revealed that the current bear market performance compares to the ones seen in Bitcoin’s recent history. The indicator in focus in this analysis is the 365-day simple moving average (SMA) on the BTC price chart.
Moreno defined the start of the bear market as the moment when the price of Bitcoin crossed below the 365-day SMA. According to the on-chain expert, the premier cryptocurrency is down by 30% so far in the current phase, making it one of the worst bear seasons in recent times.

As observed in the chart above, the bitcoin price is deeper than it is often seen at this stage of the bear market. During the 2014 bear market, the flagship cryptocurrency was barely down by 20% at this current stage of the season.
The same could be said for the 2018 bear season, which was more around the 20% market at this stage. However, the price of Bitcoin might have succumbed to greater pressure during the 2022 season, as the market leader was down from its 365-day moving average by nearly 60% at this stage of the cycle.
This trend is especially interesting, considering that Bitcoin is believed to have matured as an asset class. However, the world’s largest cryptocurrency still appears to witness incredible levels of volatility at the beginning of the bear market.
While it is unclear when the Bitcoin price will reach a bottom, certain conditions need to be met for a turnaround to occur. One of these conditions is the apparent demand metric, which has continued to worsen over the past few weeks. As seen in the outflow numbers of the US-based Bitcoin ETFs, capital constraints have been a major issue for the premier cryptocurrency.
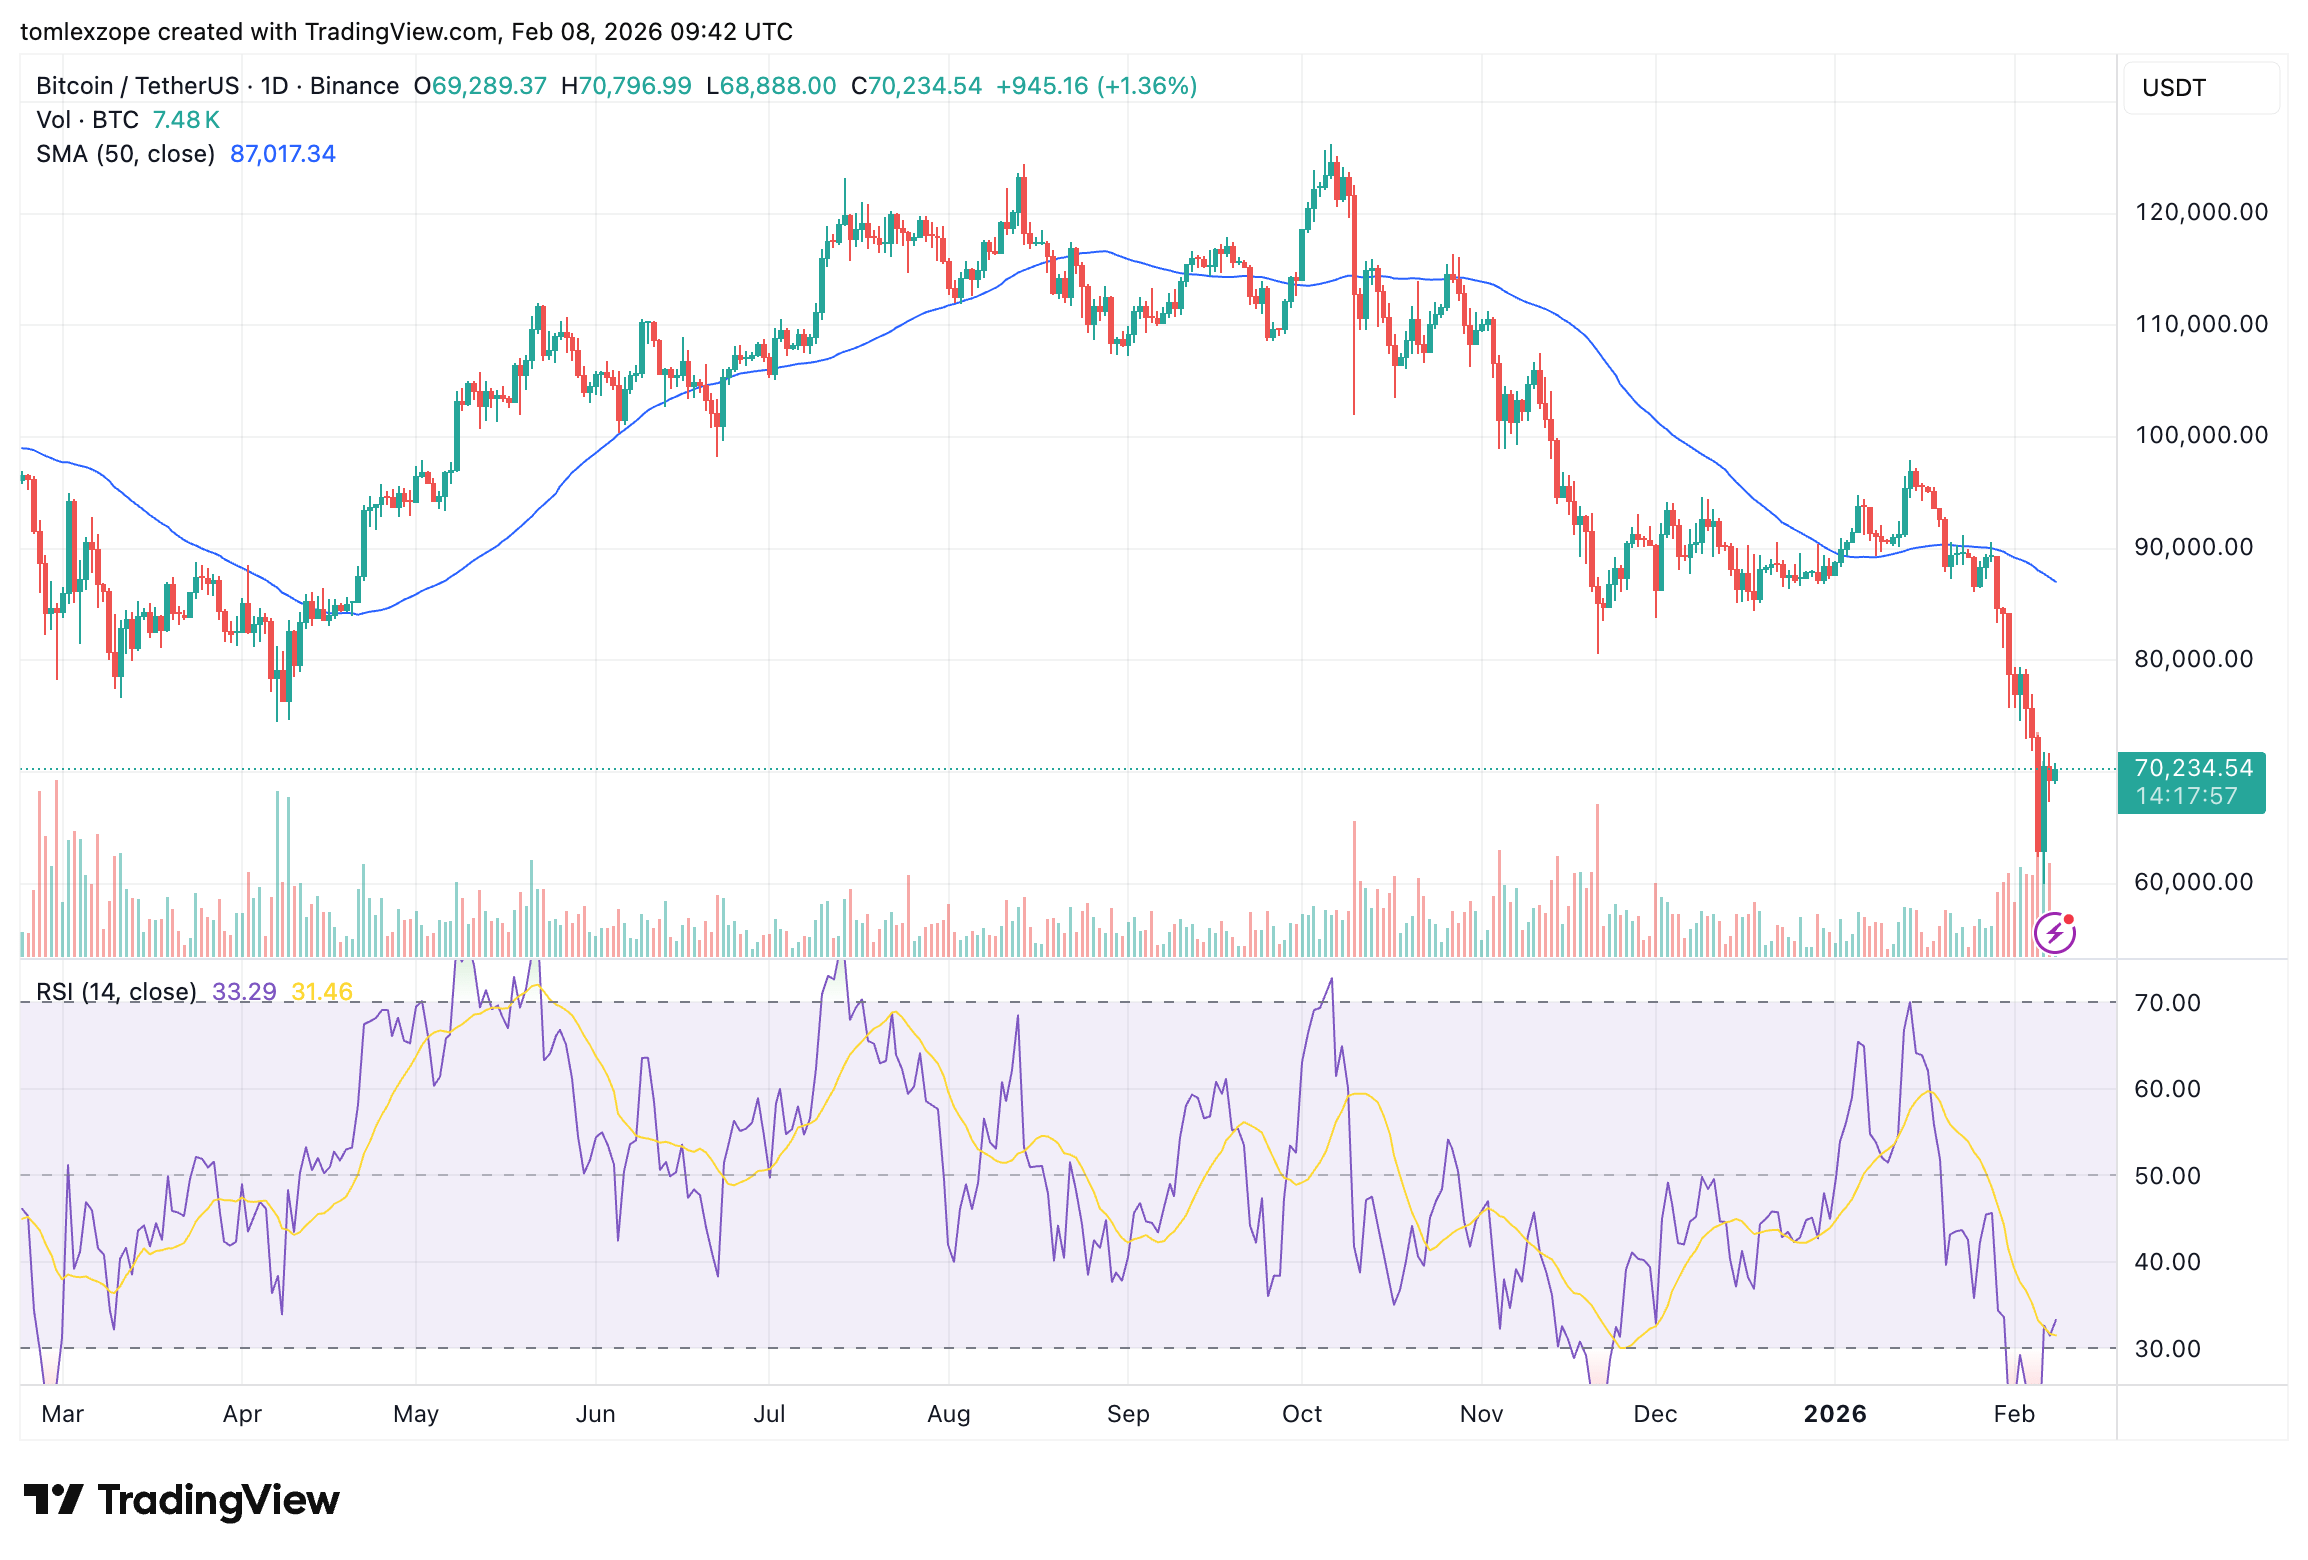
Bitcoin Price At A Glance
As of this writing, the price of BTC stands at around $70,500, reflecting an over 2% jump in the past 24 hours.