Bitcoin Market Structure Signals ’Ongoing Stress’ – Not Final Capitulation, Warns Analyst

Bitcoin's market mechanics flash warning signs—analysts spot structural stress, not the clean sweep of capitulation that typically precedes major rallies.
The Stress Test
Current on-chain and price action data paints a picture of persistent pressure. Large holders aren't dumping en masse, but they're not accumulating aggressively either—a classic sign of distribution, not panic. Liquidity remains thin, creating a market prone to sharp, volatile moves on minimal volume. This isn't the violent, high-volume flush that washes out weak hands; it's a slow grind that tests long-term conviction.
Anatomy of a Capitulation
True market bottoms often arrive with a signature: extreme fear, cascading liquidations, and a surge in coins moving at a loss. The current structure lacks that cathartic climax. Instead, it shows a market stuck between hope and reality—the kind of environment where traditional finance veterans might smirk about 'digital gold' behaving more like digital driftwood. Funding rates hover near neutral, and exchange reserves see a slow trickle, not a flood.
The Waiting Game
For bulls, this means patience. The setup suggests more consolidation or downside pressure is needed to reset the board. The market hasn't reached the peak pain threshold that forces the final, desperate sell-off. Until then, the structure indicates ongoing stress—a market searching for its next catalyst, trapped in a cycle of hope and gradual realization. The path to the next leg up likely requires one last, ugly shakeout first.
Long-Term Holder Risk Still Below Historical Capitulation Levels
On-chain Mind further highlights that long-term holder risk has historically played a decisive role in identifying late-stage bear market conditions. Previous cycles show clear peaks in this metric: roughly 95% in 2015, about 83% in 2019, NEAR 70% during the COVID crash, and around 85% in the 2022 downturn. These spikes typically reflected widespread unrealized losses among long-term investors, signaling deep structural stress across the network.
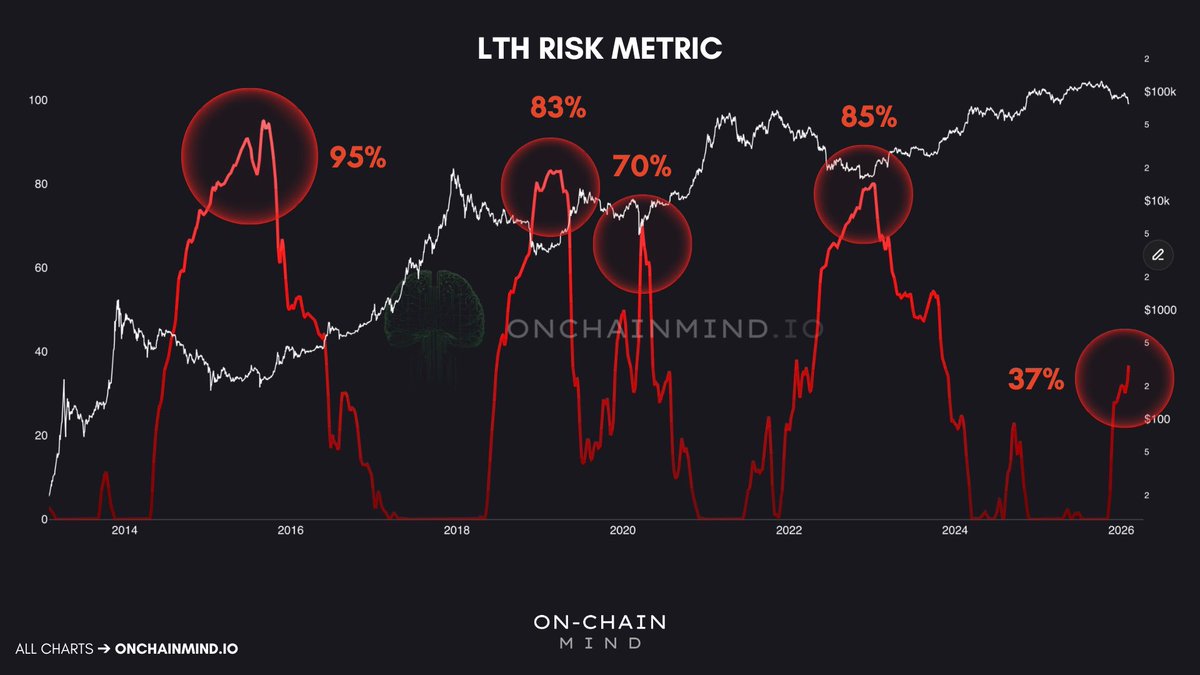
Historically, once this indicator rises above the 55–60% range, the bottoming process tends to accelerate. At those levels, even the most patient holders begin to experience meaningful pressure, often coinciding with the final phases of capitulation. This does not necessarily mark the exact price low, but it has frequently preceded stabilization and eventual recovery.
Currently, however, the metric sits closer to 37%, well below prior capitulation thresholds. This suggests that while market stress is evident, conditions may not yet reflect the full-scale exhaustion typically associated with durable cycle bottoms. If the pattern of diminishing peaks continues, a move toward the 70% region WOULD indicate that even strong hands are under substantial pressure — historically a prerequisite for a more structural and lasting market low.
Bitcoin Breaks Key Weekly Supports As Downtrend Accelerates
Bitcoin’s weekly structure shows a clear deterioration in momentum after the rejection from the $120K–$125K region, with price now trading near the $69K zone. The latest breakdown pushed bitcoin decisively below the 50-week moving average (blue) and the 100-week average (green), levels that had previously acted as dynamic support throughout the prior uptrend. Losing both signals a shift from a corrective pullback to a more structural downtrend phase.

The 200-week moving average (red) remains well below the current price, suggesting the broader macro trend is not yet in deep bear-market territory. However, the speed of the decline and expanding bearish candles indicate aggressive distribution rather than orderly consolidation. Volume spikes accompanying recent downside moves reinforce the interpretation of forced selling and liquidation activity.
From a technical standpoint, the $70K region has transitioned from support into resistance after the breakdown. Failure to quickly reclaim this level would increase the probability of further downside exploration, potentially toward historical demand zones in the low-$60K area. Conversely, stabilization above this region with declining sell volume could signal exhaustion among sellers.
Featured image from ChatGPT, chart from TradingView.com
