Bitcoin Wave 3 Crash: The Rebound Is Here—What Comes Next?

Bitcoin just shook the market—again. The so-called 'Wave 3' crash sent shockwaves through portfolios, but the king of crypto is already clawing its way back up. Forget the panic; the real story is what happens now.
The Anatomy of a Bounce
This wasn't a gentle dip—it was a full-blown correction that tested holder conviction. Yet, the rebound pattern emerging tells a more nuanced tale. It's not just about price recovery; it's about where liquidity flows when traditional finance stumbles. While Wall Street frets over basis points, Bitcoin bypasses the old guard entirely.
Beyond the Chart
Technical patterns are one thing, but market structure is another. Each of these volatility cycles does more than move numbers—it filters out weak hands and consolidates assets toward stronger ones. The network grows more resilient, even if your portfolio feels more volatile.
The Next Move
Watch the momentum, not just the price. A true post-crash phase separates strategic accumulation from reactive trading. The infrastructure built during the last bull run—from institutional custody to derivatives markets—now gets stress-tested. Spoiler: it's holding up better than most legacy banks did in 2023.
One cynical truth? Traditional finance still views this as a speculative asset, missing the forest for the trees. While they debate 'store of value,' the network keeps settling transactions and finalizing blocks—no committee meetings required. The rebound isn't just a chart pattern; it's a reminder that the system is working as designed, volatility and all.
Elliott Wave Structure Points To A Wave 3 Crash
Technical analysis shows that the recent bitcoin sell-off and crash below $80,000 fit squarely within a larger Elliott Wave structure that still points to additional downside ahead. The Bitcoin technical chart outlines an extended decline that’s been playing out from the $126,000 peak in October 2025.
TheBitcoin Historical Performance Shows How Low The Price Will Go Before A BottomBitcoin kicked off a five-wave downward impulse move after it peaked at $126,000 in October. From the October 2025 high near $126,000, Bitcoin has already fallen roughly 41%, a drawdown the analyst claims aligns closely with prior warnings of a 40% to 50% crash in the early phase of a bear market.
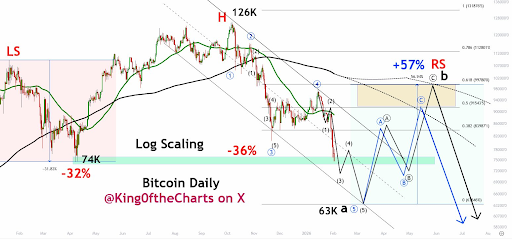
According to the analyst, Bitcoin completed its Primary Wave 4 NEAR the $97,900 region before rolling over into Primary Wave 5. This Primary Wave 5, which is a downward wave, is divided into smaller impulse waves. Within that larger decline, Bitcoin is now said to be deep inside Intermediate Wave 3, which is typically the most aggressive and damaging leg of an Elliott Wave move.
Where The Analyst Sees The Bottom Forming
Bitcoin is expected to transition into Intermediate Wave 4 after Wave 3 is completed, which may offer temporary relief or consolidation. However, that pause is expected to be followed by Intermediate Wave 5, a final leg lower that could push the bitcoin price to new cycle lows before the entire wave structure reaches completion.
Looking ahead, the analysis outlines a potential bottoming zone between $60,000 and $63,000 for Wave 5. However, the analyst noted that Bitcoin could even briefly probe lower and fall to the 200-week moving average around $58,000, before finally exhausting selling pressure. In this framework, the current rebound from the $75,000 area is viewed as a pause within the downtrend, not confirmation that the lows are in.
Once that low is established, the next outlook is that a sizeable bear-market rally will follow. The chart projects a recovery back toward the 200-day moving average, with upside targets stretching into the $90,000 to low-$100,000 range. That move was described by the analyst as a counter-trend rally before what could be the next major leg lower later in the cycle.
