Bitcoin’s 2022 Crash Pattern Reemerges - Could $20,000 Be Back on the Table?

Deja vu hits crypto markets as Bitcoin flashes a chillingly familiar technical setup.
The Pattern That Preceded Pain
Remember 2022? Of course you do. That signature chart formation—the one that preceded Bitcoin's brutal descent to the $20,000 basement—is back on the screen. It's not a prediction, but it's a warning sign that veteran traders are watching with a mix of dread and opportunistic glee. History doesn't repeat, but it often rhymes, especially when human psychology and leveraged bets are involved.
Market Mechanics Under the Microscope
The setup hinges on a confluence of factors: weakening momentum, key support levels getting tested like a fraying rope, and derivative markets flashing overheated signals. It's the same recipe that cooked up significant volatility before. The question isn't just about price, but about market structure and whether the current ecosystem is robust enough to withstand the pressure it failed to handle last time.
A Cynical Nod to Finance as Usual
Meanwhile, traditional finance pundits—who've been waiting for this moment—are already warming up their 'I told you so' speeches, conveniently forgetting their own sector's fondness for billion-dollar bailouts and creative accounting. Some things never change.
The Bottom Line
This isn't a doom prophecy. It's a reality check. In crypto's volatile world, patterns are maps, not destinies. Recognizing the map from 2022 means traders can navigate the current terrain with eyes wide open—whether that leads to strategic exits, calculated entries, or just buckling up for a bumpy ride. The $20,000 level isn't a target; it's a reminder of what's possible when sentiment shifts and leverage unwinds. Watch the charts, but trust your risk management above all.
2022 Bitcoin Chart Pattern Signals Over 20% Crash
In his technical analysis released on X, Crypto Bullet revealed that bitcoin is currently repeating a 2022 structure that could lead to a more than 20% decline in its value. To support his bearish outlook, the analyst presented a parallel chart comparing Bitcoin’s price action from 2023-2022 and 2025-2026, highlighting similar technical patterns, price behavior, and Moving Averages (MA).
During the 2022 cycle, Bitcoin experienced a similar pattern, beginning with a test of the 100-day Moving Average (MA100), highlighted as the blue trendline on the chart. After facing rejection at that level, the price pulled back to a nearby support zone inside a rising channel. From there, BTC staged a sharp rally, surging to fresh highs around $48,500, where it aligned with the 200-day Moving Average (MA200), marked in orange.
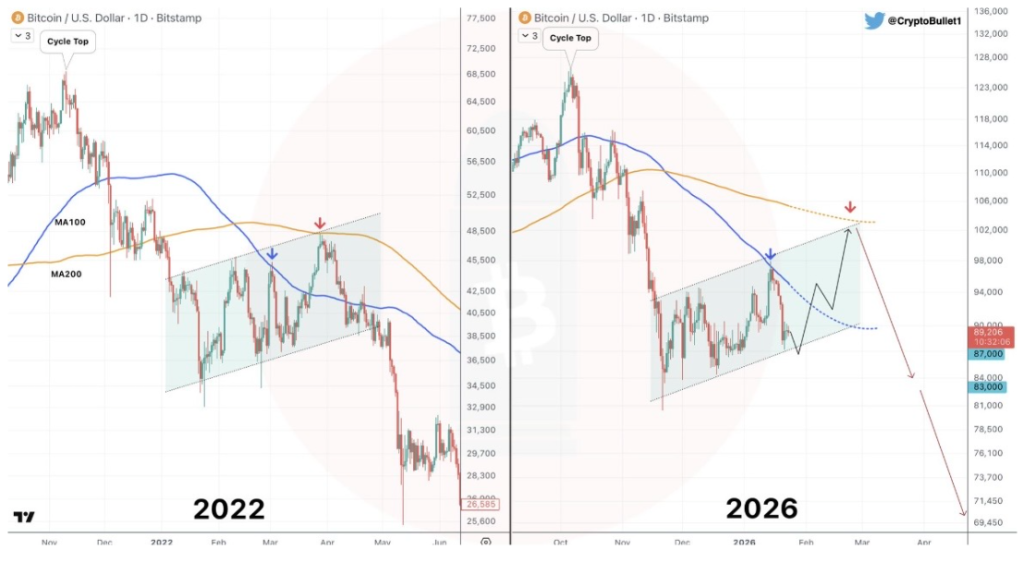
However, the recovery proved short-lived. Bitcoin soon reversed course and failed to reclaim the MA200 as support. Once the cryptocurrency’s price structure was lost, downside momentum accelerated, pushing the price into a much deeper correction toward the $20,000 level.
According to Crypto Bullet, Bitcoin is repeating this exact pattern in 2026. It has already retested the MA100, gotten rejected, and moved lower into a support zone within a similar ascending channel. The chart also showed that in both cycles, BTC reached a “market cycle top,” first around December 2023 and then again in November 2025, before breaking down and entering a consolidation phase.
Given how closely Bitcoin is mirroring its 2022 setup, Crypto Bullet has forecast another dramatic price crash, predicting a more than 23.5% drop from its current price NEAR $89,500 to $68,450. Before this decline happens, the analyst expects BTC to experience a short-term recovery, potentially climbing back above the $100,000 psychological level to reach $102,000.
Bitcoin Could Still Rally To $92,000
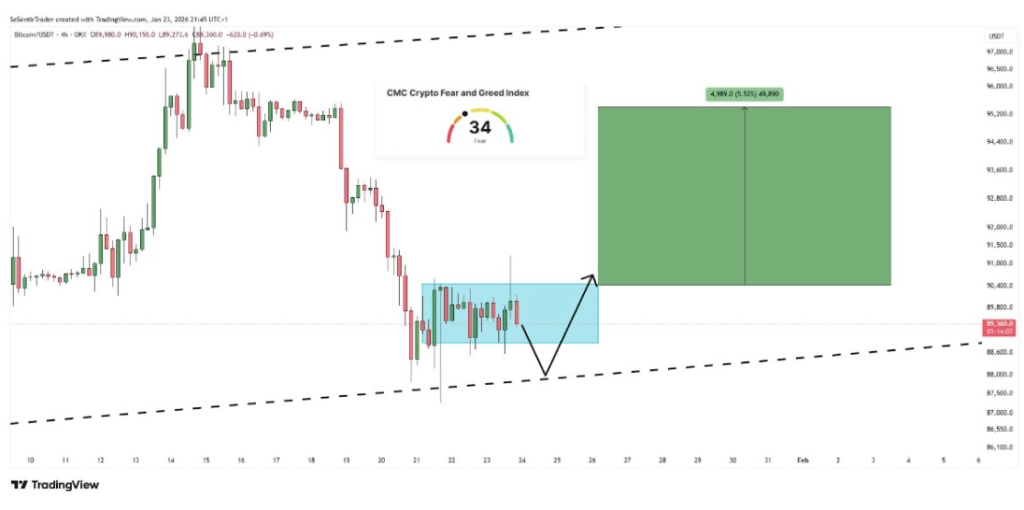
Crypto analyst Tyrex has stated that Bitcoin has been consolidating for the past 48 hours, with price holding above $89,000 for most of that period. Despite the muted price action, he believes that BTC could soon rally to $92,000. The analyst also noted that the broader market is in a state of fear, with many traders anticipating further declines in Bitcoin.
However, the analyst cautions that this expected drop may be a trap. He points out that an ascending channel is forming on Bitcoin’s chart, prompting him to adopt a more bullish outlook despite the prevailing bearish sentiment and sideways price movement.
Featured image from Unsplash, chart from TradingView
