Ethereum Defies Gravity at $3,000 as Whale Wallets Swell: The Critical Levels Every Trader Must Watch Now

Ethereum isn't just holding the line—it's drawing a battle map. While the $3,000 psychological fortress stands firm, a silent accumulation is underway in the deep. The big players are moving, and the charts are whispering where the next explosive move could land.
The Whale's Game: Accumulation vs. Distribution
Forget retail sentiment. The real story unfolds in the opaque waters of whale wallets. When these titans start hoarding, it's rarely a charitable act. They're positioning for a breakout or bracing for a storm—the on-chain data doesn't lie, even if their motives do. It's the ultimate high-stakes poker game, played with blockchain as the table.
Resistance: The Ceiling That Needs to Crack
Every rally faces a moment of truth. For Ethereum, that moment lives at a key resistance level. It's the price zone where sellers historically swarm, turning optimism into a wall of 'sell' orders. Breaking through isn't just a technical victory; it's a psychological one that flips fear into FOMO. Until then, it remains the gatekeeper to the next leg up.
Support: The Floor That Must Hold
Below the current price lies the safety net: a critical support level. This is where buyers have consistently stepped in, creating a foundation. If it holds, it confirms strength. If it cracks, the fall can be swift—a classic reminder that in crypto, what goes up must have somewhere solid to land. Watching this level is cheaper than learning the hard way.
The dance between these levels defines the market. Whales build positions, resistance tests conviction, and support provides the rebound. It's a cycle as old as trading itself, just with more jargon and fewer neckties. One cynical truth remains: the 'smart money' is often just the money that arrived early and is now telling a convincing story. Watch the levels, not the headlines.
Ethereum Accumulation Contrasts With Cautious Positioning
On-chain data shows that large Ethereum holders accumulated aggressively during the recent downturn. Whale balances increased by roughly 290,000 ETH over a two-day period, representing purchases worth close to $360 million at current prices.
This behavior suggests that some long-term investors view the recent pullback as a buying opportunity. However, other indicators point to a more cautious stance among experienced traders.
The smart money index remains below its signal line, a level that has historically been crossed ahead of stronger upside moves. In previous instances, such confirmations preceded double-digit gains, but no such signal has emerged so far.
Derivatives data support this wait-and-see approach. ETH perpetual futures funding rates briefly turned negative, indicating reduced confidence among leveraged traders. Options markets have also shown increased demand for downside protection after repeated rejections NEAR the $3,400 level over the past two months.
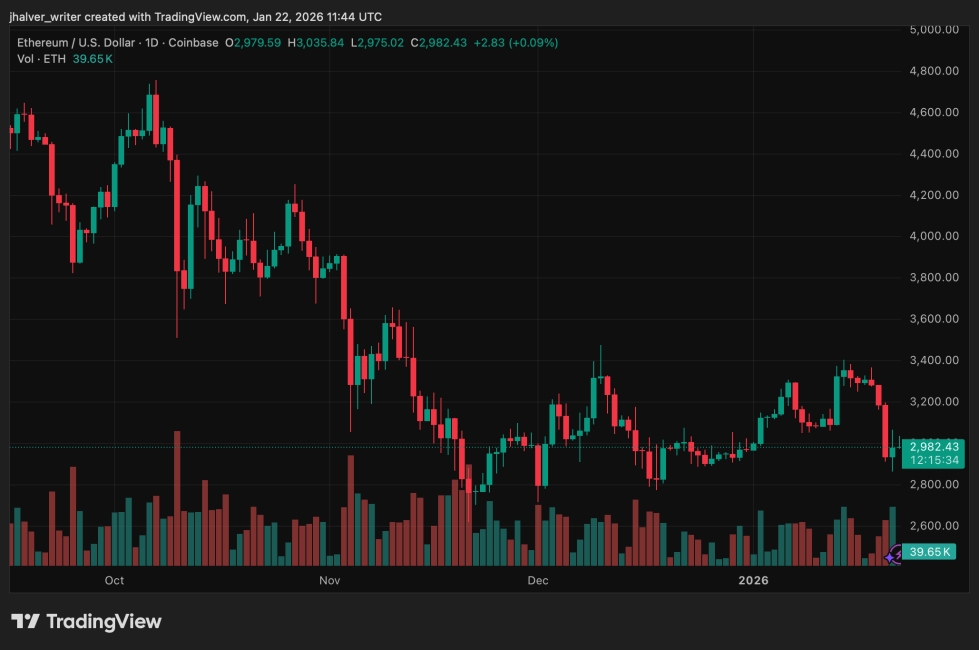
Technical Structure Highlights Tight Trading RangeFrom a technical perspective, Ethereum is trading within a symmetrical triangle on the daily chart.
Momentum indicators show a bullish divergence, the relative strength index has formed higher lows while the price made lower lows between November and mid-January. This pattern suggests that selling pressure may be weakening, though confirmation is still lacking.
The immediate level to watch on the upside is $3,050, a former support zone that ETH lost during the recent sell-off. A sustained daily close above this level WOULD indicate short-term stabilization.
Above that, the $3,146–$3,164 range represents a dense supply zone, where approximately 3.4 million ETH have been accumulated. This area is expected to act as a strong resistance.
Related Reading: Bitcoin Took Top Spot In 2025 Crypto Payments, Litecoin Third-Most Used: CoinGate
On the downside, failure to hold the triangle’s lower boundary near $2,910 could open the door to a deeper MOVE toward the $2,610 support area.
Cover image from ChatGPT, ETHUSD chart on Tradingview
