Bitcoin’s Santa Rally Window Opens Now, Analysts Signal

Forget the stockings—crypto traders are eyeing the charts. Bitcoin is entering the precise seasonal window where a 'Santa Rally' has historically taken shape, according to market analysts.
The Seasonal Catalyst
The pattern isn't guaranteed, but the setup is familiar. As traditional markets wind down and liquidity patterns shift, digital assets have often staged a late-year surge. It's a phenomenon that blends speculative momentum with a dash of year-end portfolio positioning—sometimes rational, often not.
Market Mechanics in Play
This isn't about magic; it's about mechanics. Reduced institutional selling pressure, combined with retail FOMO, can ignite a short-term bull run. The rally typically feeds on itself, drawing in sidelined capital afraid of missing a year-end bounce. After all, nothing says 'Happy Holidays' like a double-digit percentage gain.
A Balanced Dose of Reality
Seasonal trends are just one piece of the puzzle. Macro conditions, regulatory whispers, and network activity ultimately steer the ship. A Santa Rally can deliver cheer, but it's no substitute for fundamental strength. Consider it a potential short-term tailwind in a market that famously eats optimism for breakfast.
So, will Bitcoin deliver a festive gift to holders? The charts are hinting it's possible. Just remember, in crypto, even Santa checks the volatility index before taking off.
Will Bitcoin See A ‘Santa Rally’ This Year?
In his Monday Substack post, Adler framed it as a tactical setup rather than some grand, end-of-year prophecy. “The BTC market is in the upper part of the Regime Score neutral zone, which has historically shown positive expected returns,” he wrote. Then he tightened the screw: “The current liquidation structure in the futures market indicates a predominance of short position closures, creating additional mechanical pressure in favor of buyers.”
So what’s this Regime Score thing, exactly? Adler describes it as a composite indicator that “combines taker imbalance, OI pressure, funding, ETF flows, exchange flows, and price trend into a single scale from −100 to +100.” The number matters less than the band it sits in. Right now, he says the score “stands at +16.3, corresponding to the upper part of the neutral zone (+15 to +30).”
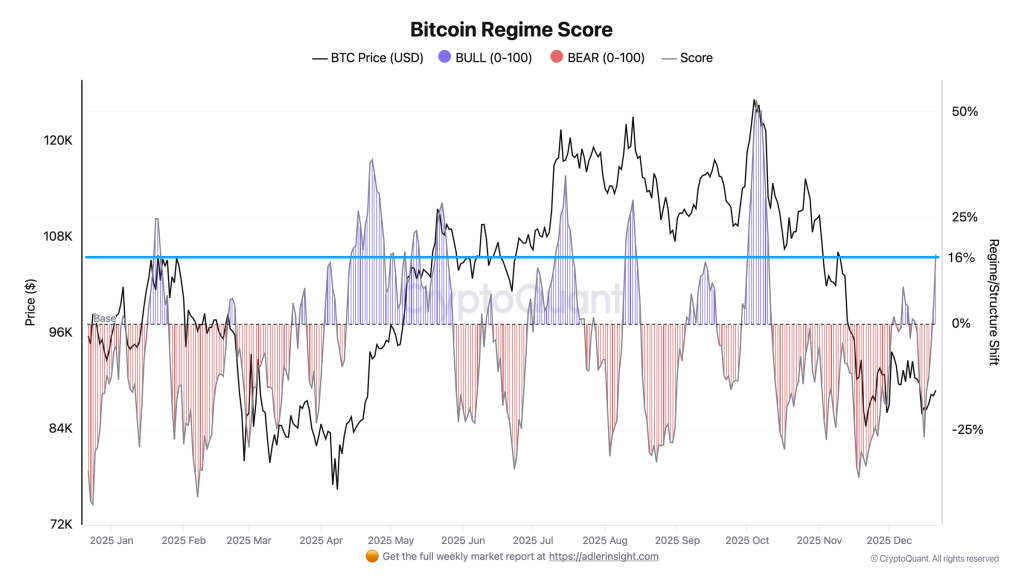
And that particular subzone is doing the heavy lifting in his argument. “Backtesting for 2025 shows this subzone historically delivered average returns of +3.8% over 30 days,” Adler wrote, contrasting it with the weaker ranges below. He also pointed out that, “unlike the −15 to 0 subzone where expected returns were negative (−1.5% over 7d),” the +15 to +30 band tended to be a more forgiving place to put on risk.
It’s also worth noting how quickly the tape can flip, because his own charting suggests it already did. Adler says the indicator “has emerged from a recent bearish phase (score dropped to −27 a week ago) and is showing recovery.” That’s the kind of detail traders latch onto: not just where you are, but how fast you got there.
But here’s the funny part — the “most bullish” zone, in his backtest, wasn’t actually bullish for forward returns. He flags that “transition into the formal Bull regime (+30 and above) historically coincided with local tops” and that it “delivered negative average returns of −3.3% over 7 days.” In other words, if you wait for the indicator to scream “bull market,” you might be buying the exact moment everyone else is already leaning the same way.
Which is why Adler ends up with a pretty trader-ish conclusion: the current band might be the sweet spot because it’s optimistic without being euphoric.
“This means the current +15–30 zone may be optimal for tactical positions, while aggressive accumulation upon breaking +30 carries elevated risk,” he wrote.
Then there’s the derivatives side — the part that can turn a calm-looking market into a sudden wick up (or down) just because leverage is sitting in the wrong place. Adler’s liquidation dominance oscillator is currently negative, which he reads as a short liquidation skew. “The oscillator’s current value has dropped into negative territory (−11%), while the 30-day moving average remains positive (+10%). This divergence points to a recent surge in forced short position closures,” he wrote.
He doubles down with a second stat: “Long Liquidation Dominance stands at 44%, below the 50% baseline, confirming the predominance of short liquidations.” Put simply: more shorts are getting forced out than longs are getting wiped, and those forced closes are buys.
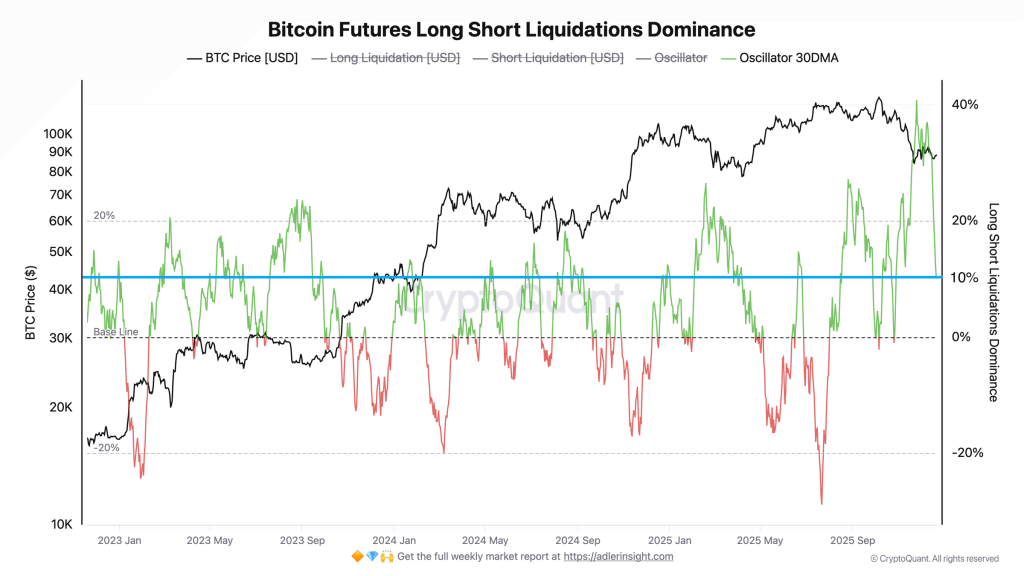
And his takeaway is basically: this is tactical fuel. “The predominance of short liquidations creates tactical fuel for upside,” Adler wrote, adding that the setup “reinforces the positive signal from Regime Score: the market has not only entered a zone with historically positive expected returns but is also receiving additional support from derivatives structure.”
Still, this is Bitcoin, and these setups don’t last forever. Adler even lays out what WOULD invalidate it, in pretty plain language. “A return of Regime Score below zero accompanied by a reversal of the liquidation oscillator into positive territory (rising long liquidations) would signal exhaustion of the current impulse,” he wrote. Translation: if longs start being the ones getting punished, that “asymmetry” flips.
For now, he’s calling it a “bullish neutrality” moment. Not full-blown melt-up territory, not the kind of reading that screams “local top” either. Just a window where, if the market wants to drift higher into year-end, the positioning doesn’t look like it’s going to fight it.
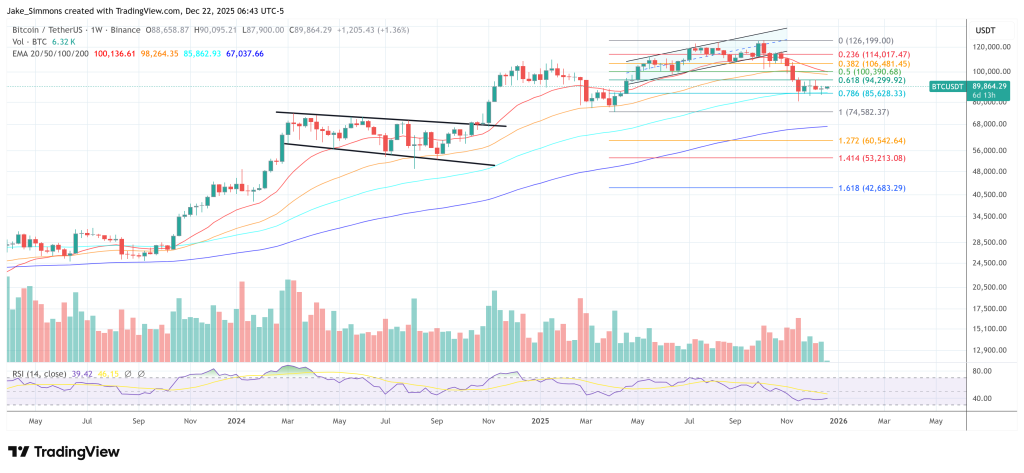
At press time, Bitcoin traded at $89,864.