Bitcoin’s Speculative Frenzy Cools Dramatically: IFP Plunge Signals Market Shift

Bitcoin's speculative engine is hitting the brakes—hard. The latest data shows a steep slide in the IFP, a key gauge of market froth, suggesting the wild ride might be entering a new, more sober phase.
The Cooling Mechanism
Forget the rocket emojis for a second. The metrics tracking pure, unadulterated speculation are nosediving. This isn't about fading fundamentals; it's about traders finally taking a breath after a long sprint. The market's pulse, measured by the intensity of short-term bets, is slowing to a steadier rhythm.
What a Plunge Really Means
A steep decline in speculative activity often acts as a pressure release valve. It shakes out the weak hands—the folks who bought the top just to post about it—and can lay a more stable foundation. Think of it less as a crash and more as the market clearing its throat before it speaks again. After all, sustainable rallies aren't built on leverage alone; they need actual conviction.
The big money watches these slides closely. A cooler market can be a cleaner one, where price discovery isn't drowned out by the noise of day traders chasing 100x memecoins. It separates the signal from the, well, let's call it 'enthusiastic speculation.'
The New Floor
This shift doesn't spell doom; it recalibrates expectations. The manic phase that pushes assets to dizzying heights is thrilling but fleeting. What follows is often the real work—consolidation, accumulation, and the boring grind that Wall Street analysts will later call 'a healthy correction' in their overpriced reports.
Bitcoin's story has never been a straight line up. It's a series of manic peaks and painful troughs, each cycle washing out a different crowd of speculators. This latest cooldown might just be the market's way of preparing for the next chapter, one where patience proves more valuable than panic. Because in crypto, the only thing sharper than the rallies are the corrections—and the lessons they hand out for free.
Bitcoin IFP Has Witnessed A Plunge Recently
In a new post on X, CryptoQuant community analyst Maartunn has talked about the trajectory that the bitcoin IFP has been following recently. The IFP refers to an on-chain indicator that measures the BTC flows taking place between spot and derivatives exchanges.
When the value of this metric is going up, it means investors are ramping up transactions to derivatives platforms. Such a trend can be a sign that demand for speculation is on the rise.
On the other hand, the indicator witnessing a decline implies fewer coins are traveling from spot exchanges to derivatives ones. This kind of trend can suggest traders are lowering their appetite for risk.
Now, here is the chart shared by Maartunn that shows the trend in the Bitcoin IFP and its 90-day moving average (MA) over the past decade:
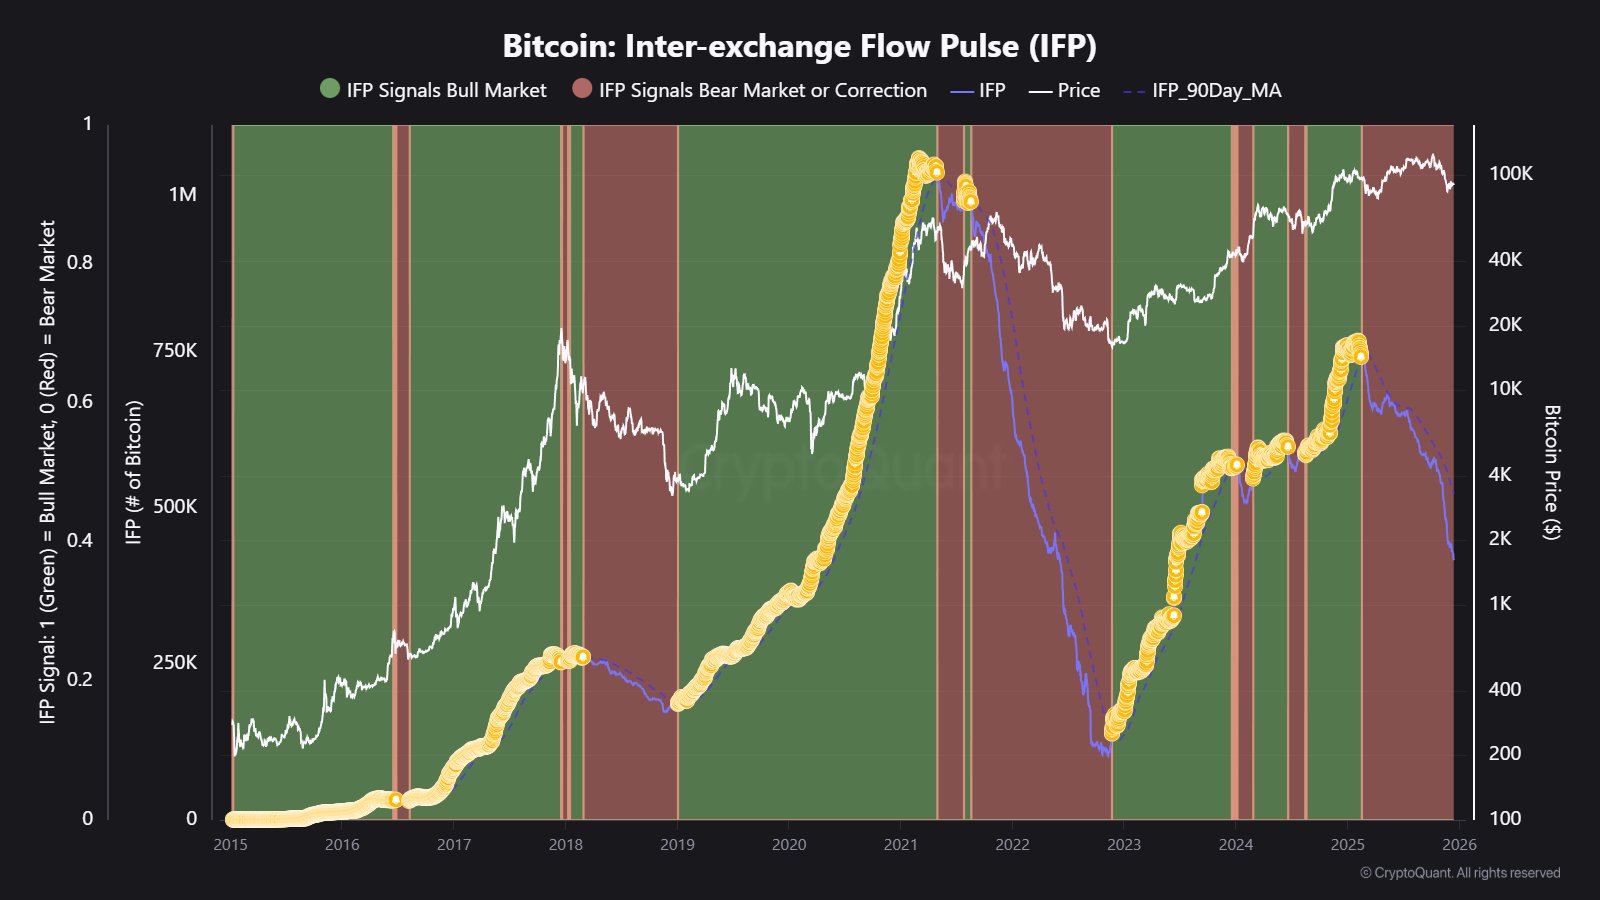
As is visible in the above graph, the Bitcoin IFP was witnessing an uptrend in the last few months of 2024, but with the start of this year, a reversal in the indicator occurred. The switch to a downtrend meant that its value slipped below the 90-day MA, something that has historically signaled bearish conditions.
Over the course of 2025, the IFP has continued its downward trajectory, but lately, the decline has accelerated, indicating that derivatives interest is cooling off fast.
Two cycles ago, the IFP sliding below its 90-day MA led into the 2018 bear market. In the 2021 bull market, the bear signal on the IFP was initially followed by the second half of that bull run, but then the 2022 bear market took over as the metric failed to recover.
A similar trend has been witnessed this year as well, with Bitcoin exploring new all-time highs (ATHs) despite the IFP suggesting bearish conditions. The recent acceleration in the indicator’s downtrend, however, has been accompanied by a bearish period in the asset’s price. Only time will tell whether this is a repeat of the pattern from the last cycle, or if risk appetite will make a comeback among investors and the IFP will reverse course.
In some other news, the Bitcoin treasury companies have seen their holdings go up recently, despite the drawdown that the market has faced, as pointed out by Glassnode co-founder Rafael in an X post.
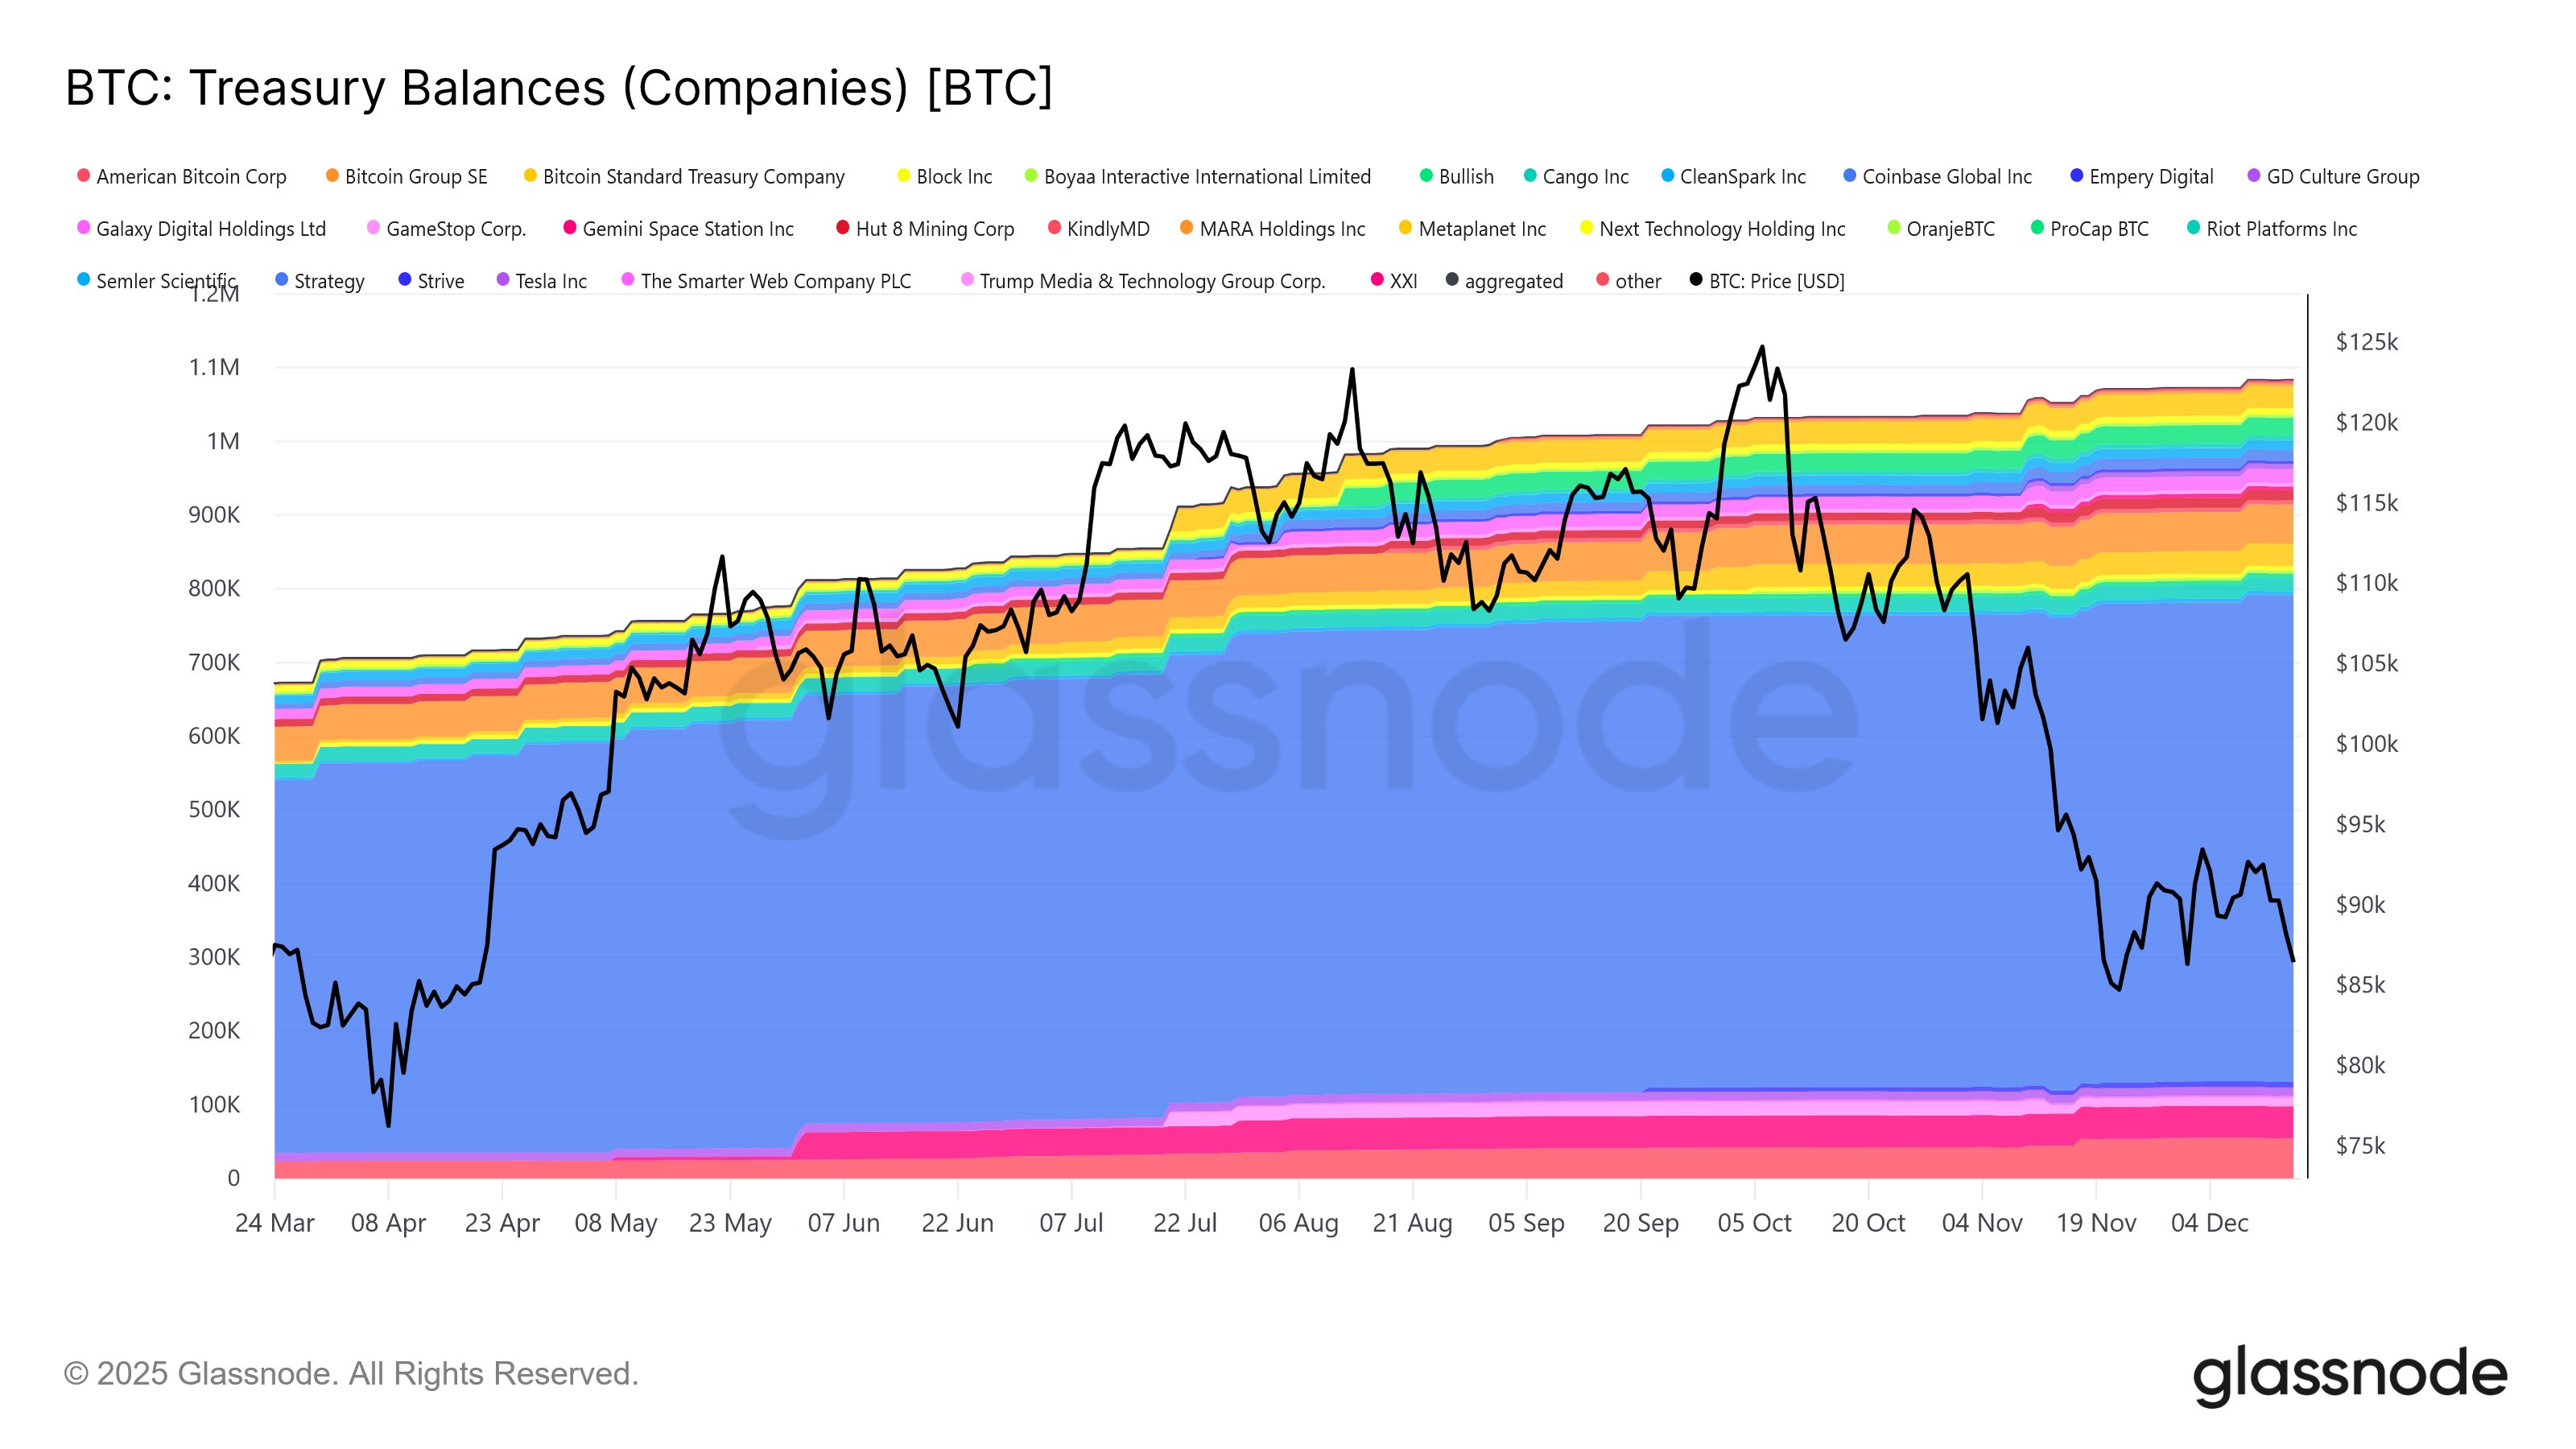
From the chart, it’s apparent that since Bitcoin started declining from its ATH above $126,000, the treasury companies have still continued a net upward trajectory. “Not seeing much of the alleged forced selling here despite some equities trading below mNAV,” noted Rafael.
BTC Price
At the time of writing, Bitcoin is trading around $87,500, down over 7% in the last week.
