Wall Street’s XRP Obsession: US Spot ETFs Extend Buying Streak to 19 Straight Days

Wall Street isn't just flirting with XRP anymore—it's moving in. The institutional money tap is wide open, and the flow shows zero signs of slowing down.
The Streak That Won't Quit
Forget a few days of tentative interest. We're talking a relentless, 19-day torrent of capital pouring into US spot XRP ETFs. That's not a trend; it's a statement. It's the kind of sustained institutional endorsement that turns a speculative asset into a portfolio staple. The old guard is finally putting its money where its mouth is, and the numbers don't lie.
Decoding the Institutional Playbook
This isn't retail FOMO. This is cold, calculated allocation from firms that measure risk in basis points and volatility in annual reports. A 19-day inflow streak signals a fundamental shift in perception—from viewing XRP as a courtroom drama to treating it as a viable liquidity and settlement rail. They're not betting on hype; they're building positions in infrastructure.
What the Smart Money Sees
The sustained buying points to a deeper conviction. It suggests institutions are looking past daily price chatter and focusing on utility, adoption pipelines, and regulatory clarity. While pundits debate, portfolio managers are executing. It's a classic case of capital voting before the narrative fully catches up—a quiet accumulation phase that often precedes major re-ratings.
So, while traditional finance pundits are still busy explaining why crypto can't work, their own industry's capital is busy proving them wrong—one automated trade at a time. The tape tells the real story, and right now, it's spelling 'accumulation' in bold.
XRP ETFs Log 19 Straight Trading Days Of Inflows
The early days did most of the heavy lifting. Sosovalue’s table shows $243.05 million of net inflow on Nov. 14, then another surge on Nov. 24 ($164.04 million). There were also chunky adds on Nov. 20 ($118.15 million) and Dec. 1 ($89.65 million). Even as the pace cooled, inflows didn’t flip—Dec. 8 posted $38.04 million, and Dec. 12 added another $20.17 million.
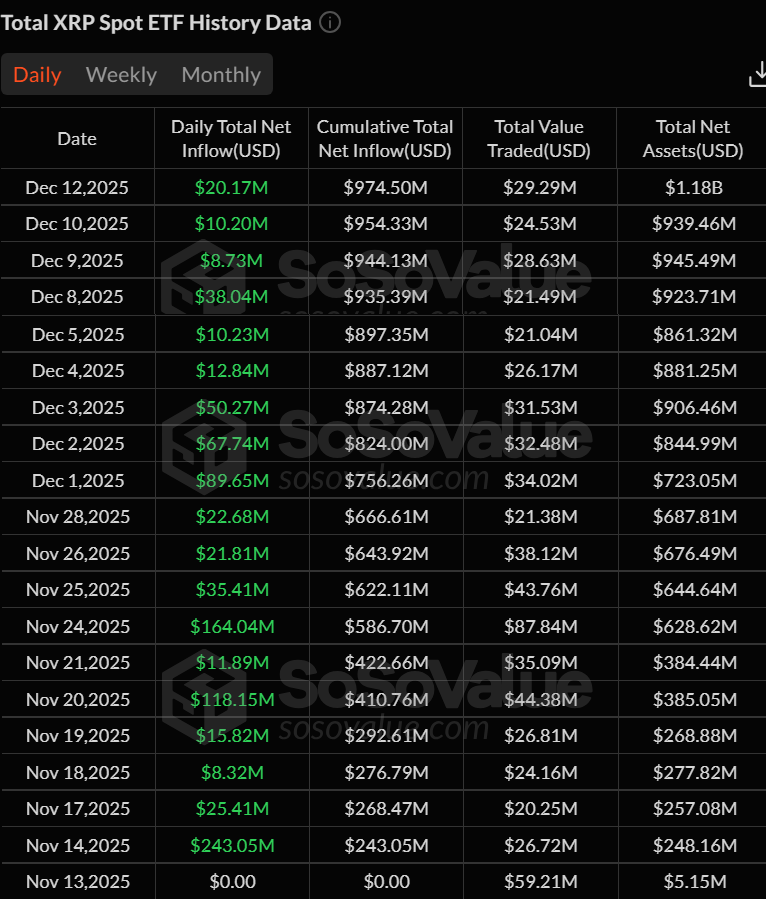
On X, Bitmern Mining founder and CEO Giannis Andreou framed it bluntly today: “19 consecutive trading days of inflows. Zero outflow days. Nearly $1B in net capital added.” He called it “sustained institutional positioning,” not retail froth.
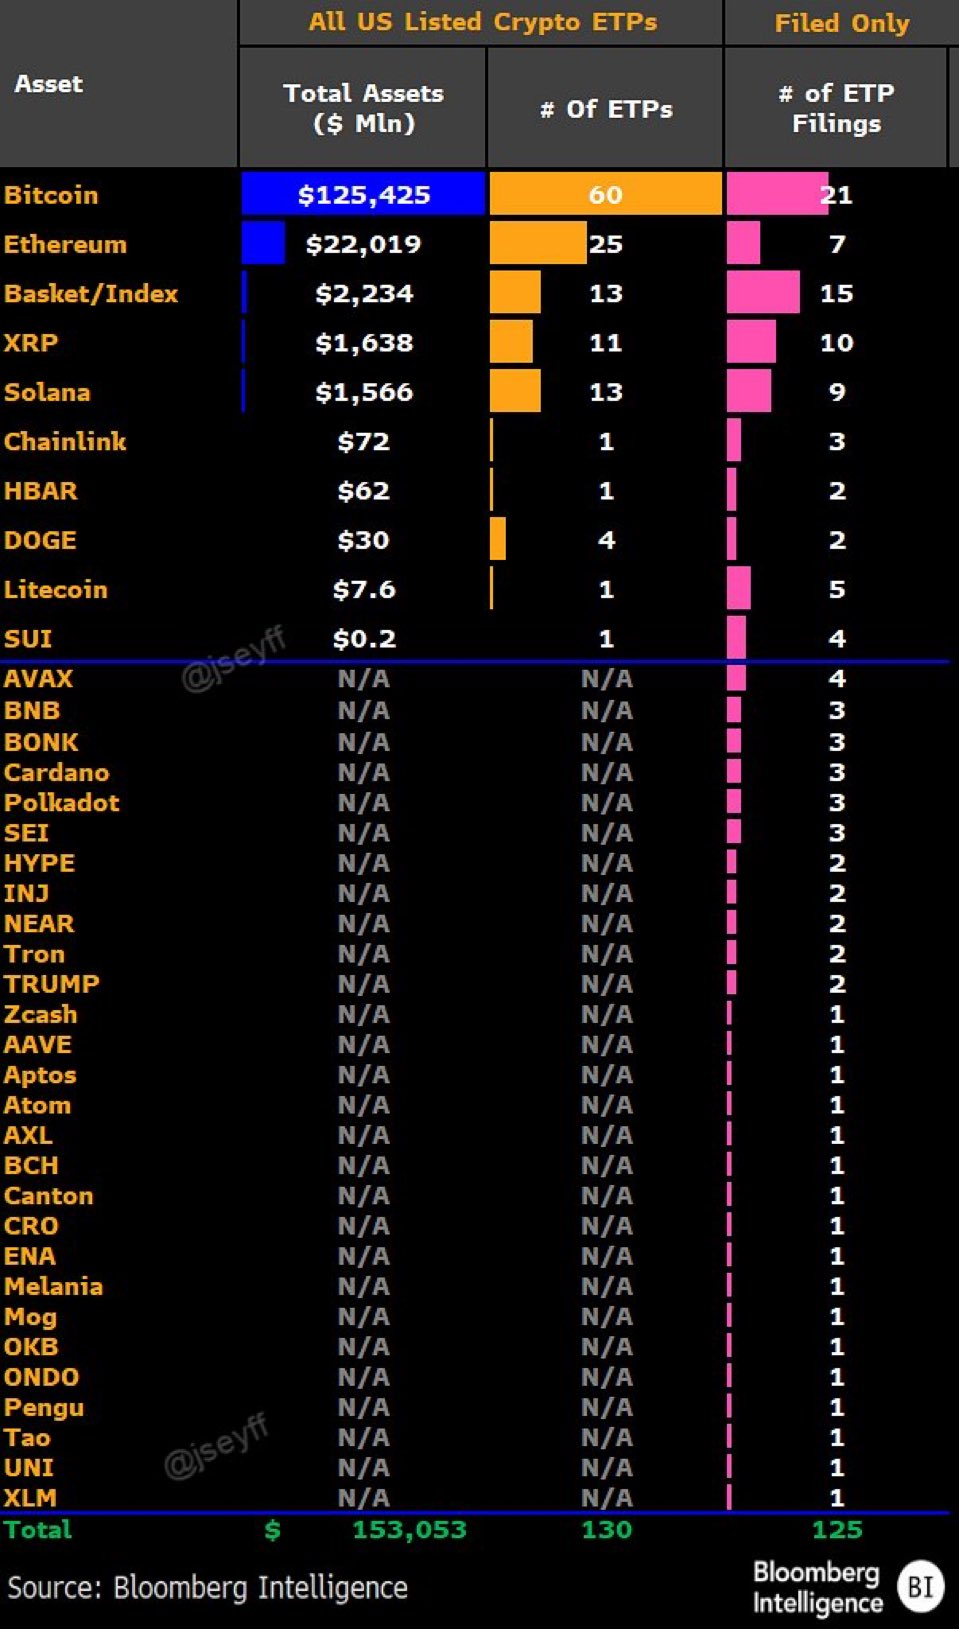
That “institutional bid” angle is also showing up in the asset rankings. In a Dec. 13 post, Canary Capital CEO Steven McClurg pointed to a separate snapshot of the US crypto ETP landscape showing XRP products now edging out solana by total assets under management.
Bloomberg Intelligence data in the chart puts XRP ETP assets at about $1.638 billion, just ahead of Solana at $1.566 billion, in a market where Bitcoin still towers over everything at $125.425 billion and ethereum sits at $22.019 billion.
McClurg’s explanation for the flip was less about Solana underperforming and more about where each asset “fits” in the wrapper trade.
“SOL ETFs launched before XRP, but XRP ETFs have now passed SOL in total AUM. I expected this,” McClurg wrote, adding “SOL is much more efficient to hold on-chain and to stake directly for retail audiences, whereas XRP has more institutional demand and no staking. As with everything, there will be an audience that prefers direct ownership, and an audience that prefers the ease of financial instruments. Some will do both.”
Notably, from Dec. 8 to Dec. 12, Bitcoin spot ETFs recorded net inflows of $287 million for the week, while Ethereum spot ETFs saw weekly net inflows of $209 million. SOL spot ETFs recorded net inflows of $33.6 million.
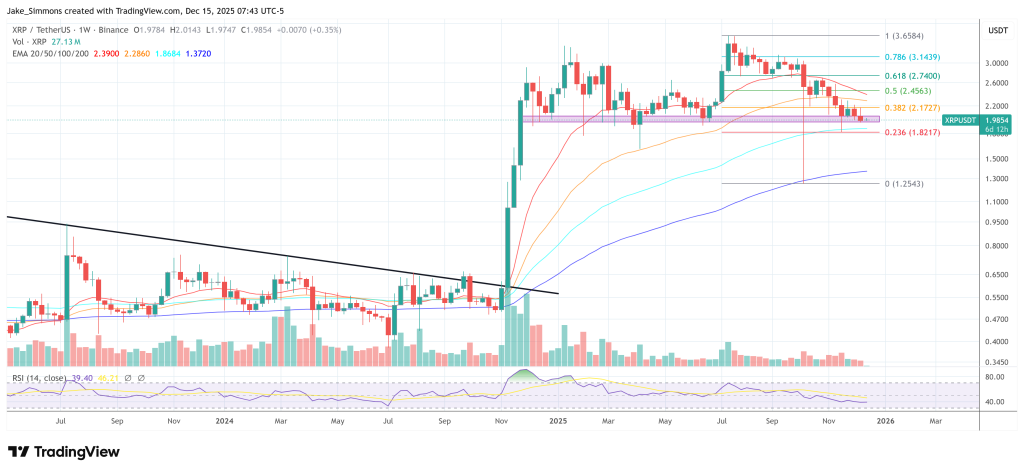
At press time, XRP once again fell below the $2 mark. The token traded at $1.98 and thus at the key support zone. A drop below the red support band could strengthen the bear case for a deeper crash to the 100-week or even 200-week Exponential Moving Average (EMA). XRP visited the latter during the October 10 crash.