Pre-FOMC Tension: Will Bitcoin Repeat Its Post-Rate Cut Surge?

Markets hold their breath as the Fed's decision looms. Bitcoin traders are eyeing the charts, hunting for patterns from the last cycle.
The Ghost of Cuts Past
Remember the last rate cut? Bitcoin didn't just rally—it staged a full-scale breakout, leaving traditional hedges in the dust. The question on every crypto desk isn't *if* the Fed will move, but how digital gold will react when it does.
Decoupling From the Old Guard
Forget bonds and boring ETFs. Bitcoin's liquidity operates on a different clock—global, 24/7, and utterly indifferent to Wall Street's opening bell. A dovish pivot could send institutional capital scrambling for the exit in treasuries... and straight into crypto's waiting arms.
The Real Signal is in the Hash Rate
While pundits parse Powell's every syllable, the real narrative is written in code. Network fundamentals—hash power, active addresses, stablecoin inflows—often flash green before the headlines catch up. Smart money watches the chain, not CNBC.
A Provocative Close
History doesn't repeat, but it often rhymes. If the Fed flinches, Bitcoin's reaction won't be a gentle nod—it'll be a statement. After all, in a world where central banks print 'stimulus' with a keystroke, a fixed-supply asset starts to look less like a gamble and more like the only adult in the room. Just don't tell the guys in suits.
Historical Patterns Signal Caution Ahead of the FOMC
According to the report by GugaOnChain on CryptoQuant, Bitcoin’s past reactions to Federal Reserve rate cuts offer a clear framework for understanding the risks heading into this week’s FOMC meeting. The historical data paints a picture of mixed and often counterintuitive behavior.
For example, following the 25 basis point cuts in September 2025, bitcoin barely reacted at all. In another instance, BTC surged to a four-week high—only to drop nearly $2,000 shortly after, settling into a period of muted stability. These reactions underscore how quickly sentiment can shift once policy decisions are fully priced in.
Volatility has also played a defining role. Both the September and October rate decisions triggered brief pre-FOMC rallies, followed by notable declines once the announcements were made. After the September cut, volatility spiked sharply as traders unwound Leveraged positions, revealing how sensitive Bitcoin remains to event-driven positioning.

This leads to the recurring “buy the rumor, sell the news” pattern, a dynamic that GugaOnChain warns could repeat. Because of this, monitoring market leverage—including funding rates and open interest—is crucial. Equally important are liquidity flows, such as exchange reserves and ETF activity. Together, these indicators help traders anticipate short-term price movements as Bitcoin prepares for another potentially volatile macro event.
Testing Recovery but Still Below Key Trend Levels
Bitcoin’s weekly chart shows the market attempting to stabilize above the $92,000 level after a sharp multi-week correction from the $120,000 region. The recent rebound from the $89,000–$90,000 zone highlights strong demand at the 100-week moving average (green line), which is currently acting as a critical dynamic support.
Historically, this MA has served as a structural backbone for Bitcoin during mid-cycle pullbacks, and the latest bounce reinforces its relevance.
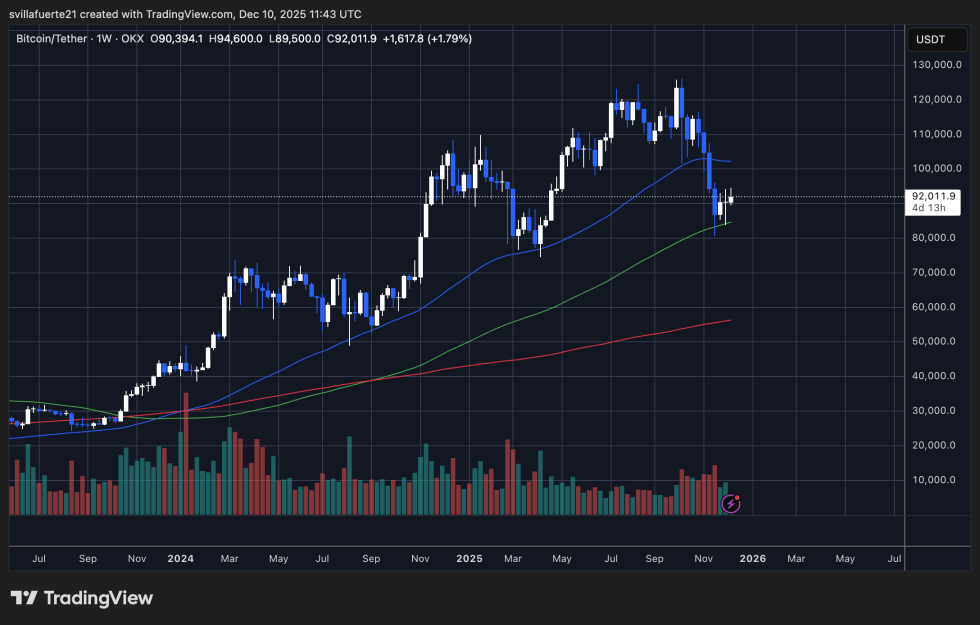
However, despite the recovery, BTC remains firmly below the 50-week moving average (blue line), a level that previously marked bullish continuation phases throughout 2024 and early 2025. Until price reclaims this region—now sitting NEAR $100,000—the broader market structure leans corrective rather than impulsively bullish. The lower highs formed since the peak also suggest that bears still retain control over the medium-term trend.
Volume behavior adds another layer: although buying volume has picked up modestly, it remains significantly weaker than the aggressive selling pressure seen during the November–December decline. This indicates that buyers are showing interest, but conviction has yet to return in full force.
Featured image from ChatGPT, chart from TradingView.com
