Bitcoin’s Most Reactive Group Faces Heavy Losses: Drawdowns Now Match Prior Cycle Bottoms

Bitcoin's most sensitive cohort is getting hammered. The losses are piling up, and the drawdowns are starting to look eerily familiar—they've reached levels last seen at the bottom of previous market cycles. It's a gut-check moment for the fast-money crowd.
The Pain Threshold
For the traders and funds that move on every headline and tick, this isn't a minor correction. It's a full-scale retreat. The depth of the current pullback now mirrors the historic lows that marked the end of prior bear phases. That's a data point that gets everyone's attention, from crypto-native desks to the traditional finance tourists who just discovered 'digital gold' last quarter.
Cycle Rhymes, But Doesn't Repeat
Markets have memory, and Bitcoin's price action is no exception. Seeing current declines align with past cycle bottoms creates a powerful narrative. It fuels the debate: is this the final flush before the next leg up, or just another pit stop on the way down? The reactive players are the canary in the coal mine—their extreme losses often signal a sentiment capitulation that historically precedes a reversal. Of course, past performance is the favorite bedtime story of every fund manager trying to justify their fees.
A Test of Conviction
This is where weak hands get shaken out. The high-beta, reactive strategies are bleeding, testing the resolve of anyone without a multi-year horizon. For the rest of the market, it's a stark reminder that crypto volatility isn't a bug—it's the core feature. The real question isn't about matching a drawdown percentage from a chart; it's about who's left standing when the dust settles and the next cycle, inevitably, begins.
Short-Term Holder Capitulation Often Signals Bottom Formation
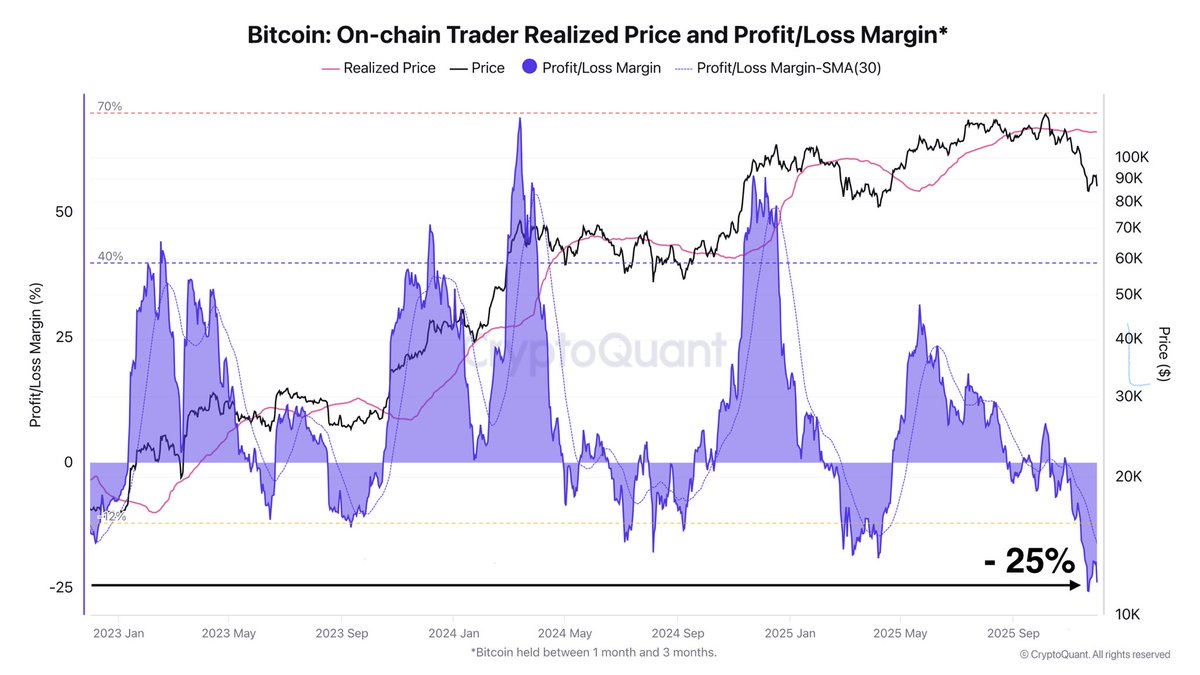
Darkfost highlights that the 1–3 month bitcoin holder cohort has now spent nearly two weeks sitting on average unrealized losses between 20% and 25%. Historically, this type of drawdown among short-term participants has tended to occur near cyclical bottom formation.
These traders typically react quickly to volatility, and when their losses reach this depth, they are pushed into a critical decision point: sell and exit the market, or hold and endure further downside.
Throughout this cycle, similar phases of elevated losses have preceded major inflection points. Once a large portion of these speculative holders capitulates — a process that appears to have been unfolding in recent weeks — selling pressure usually begins to exhaust. This shift often creates an environment where accumulation becomes far more attractive for patient investors who track sentiment and realized-price dynamics.
However, Darkfost emphasizes that this pattern only holds if the long-term bullish trend remains intact. Structural on-chain indicators, broader demand trends, and long-horizon holder behavior continue to support the idea that Bitcoin’s macro trend has not been invalidated.
While volatility may persist in the short term, the alignment of capitulation signals with a still-intact long-term structure suggests that current levels could become an opportunity for strategic accumulation.
Bitcoin Tests Weekly Level as Market Searches for Higher-Timeframe Support
Bitcoin’s weekly chart shows the most significant corrective phase since the early stages of the cycle, with price falling sharply from the $120,000 region and now attempting to stabilize around the 100 SMA NEAR $84,000–$85,000. This moving average has historically acted as a major structural support during bull markets, and BTC’s current interaction with it marks a critical juncture for the broader trend.

The breakdown below the 50 SMA was a clear sign of weakening momentum, signaling that sellers have gained control of the higher-timeframe structure. However, the wick formed beneath the 100 SMA suggests that buyers are beginning to step in, attempting to defend this crucial zone. The reaction so far is constructive but not yet decisive — BTC needs a stronger weekly close above $90,000 to confirm stability.
Volume has increased during the decline, indicating forced selling and capitulation rather than organic trend reversal. Historically, pullbacks into the 100 SMA often precede medium-term bottoms within a long-term bullish market, but continuation depends on whether BTC can avoid a sustained weekly close below this level.
Featured image from ChatGPT, chart from TradingView.com
