Bitcoin Capitulation Hits Historic Stress Levels Matching COVID Crash, China Ban & Luna Collapse

Bitcoin's current capitulation phase mirrors three of crypto's most brutal stress tests—and veteran traders are taking notice.
The Perfect Storm Triggers
Market data reveals BTC's current pain levels align precisely with March 2020's COVID crash, China's 2021 mining ban aftermath, and Terra Luna's ecosystem collapse. Each event triggered massive liquidations followed by explosive recoveries.
Institutional Blood in the Streets
Whale wallets are accumulating while retail investors panic-sell—a classic reversal signal that historically precedes major rallies. Derivatives markets show extreme fear with funding rates hitting yearly lows.
History's Compass Points Up
Previous capitulation events saw Bitcoin surge 150-400% within 12 months post-bottom. The current stress levels suggest we're either witnessing systemic collapse or the buying opportunity of the decade—Wall Street analysts can't decide which narrative sells better to clients.
When markets can't distinguish between fundamental collapse and generational entry points, smart money starts stacking sats while traditional finance debates PowerPoint colors.
Short-Term Holder Capitulation Deepens as Macro Pressure Overrides Behavioral Signals
Axel Adler explains that short-term holders are now realizing losses with an intensity comparable to some of Bitcoin’s most violent historical shocks — including the COVID crash of 2020, the China mining ban in 2021, and the Luna collapse in 2022.
The latest data shows that SOPR Momentum, a key indicator of realized profitability, has dropped nearly to 0, a level that typically marks full capitulation among reactive market participants. Historically, readings this depressed have aligned with explosive V-shaped reversals or sharp relief rallies, as selling pressure becomes exhausted and stronger hands begin absorbing supply.
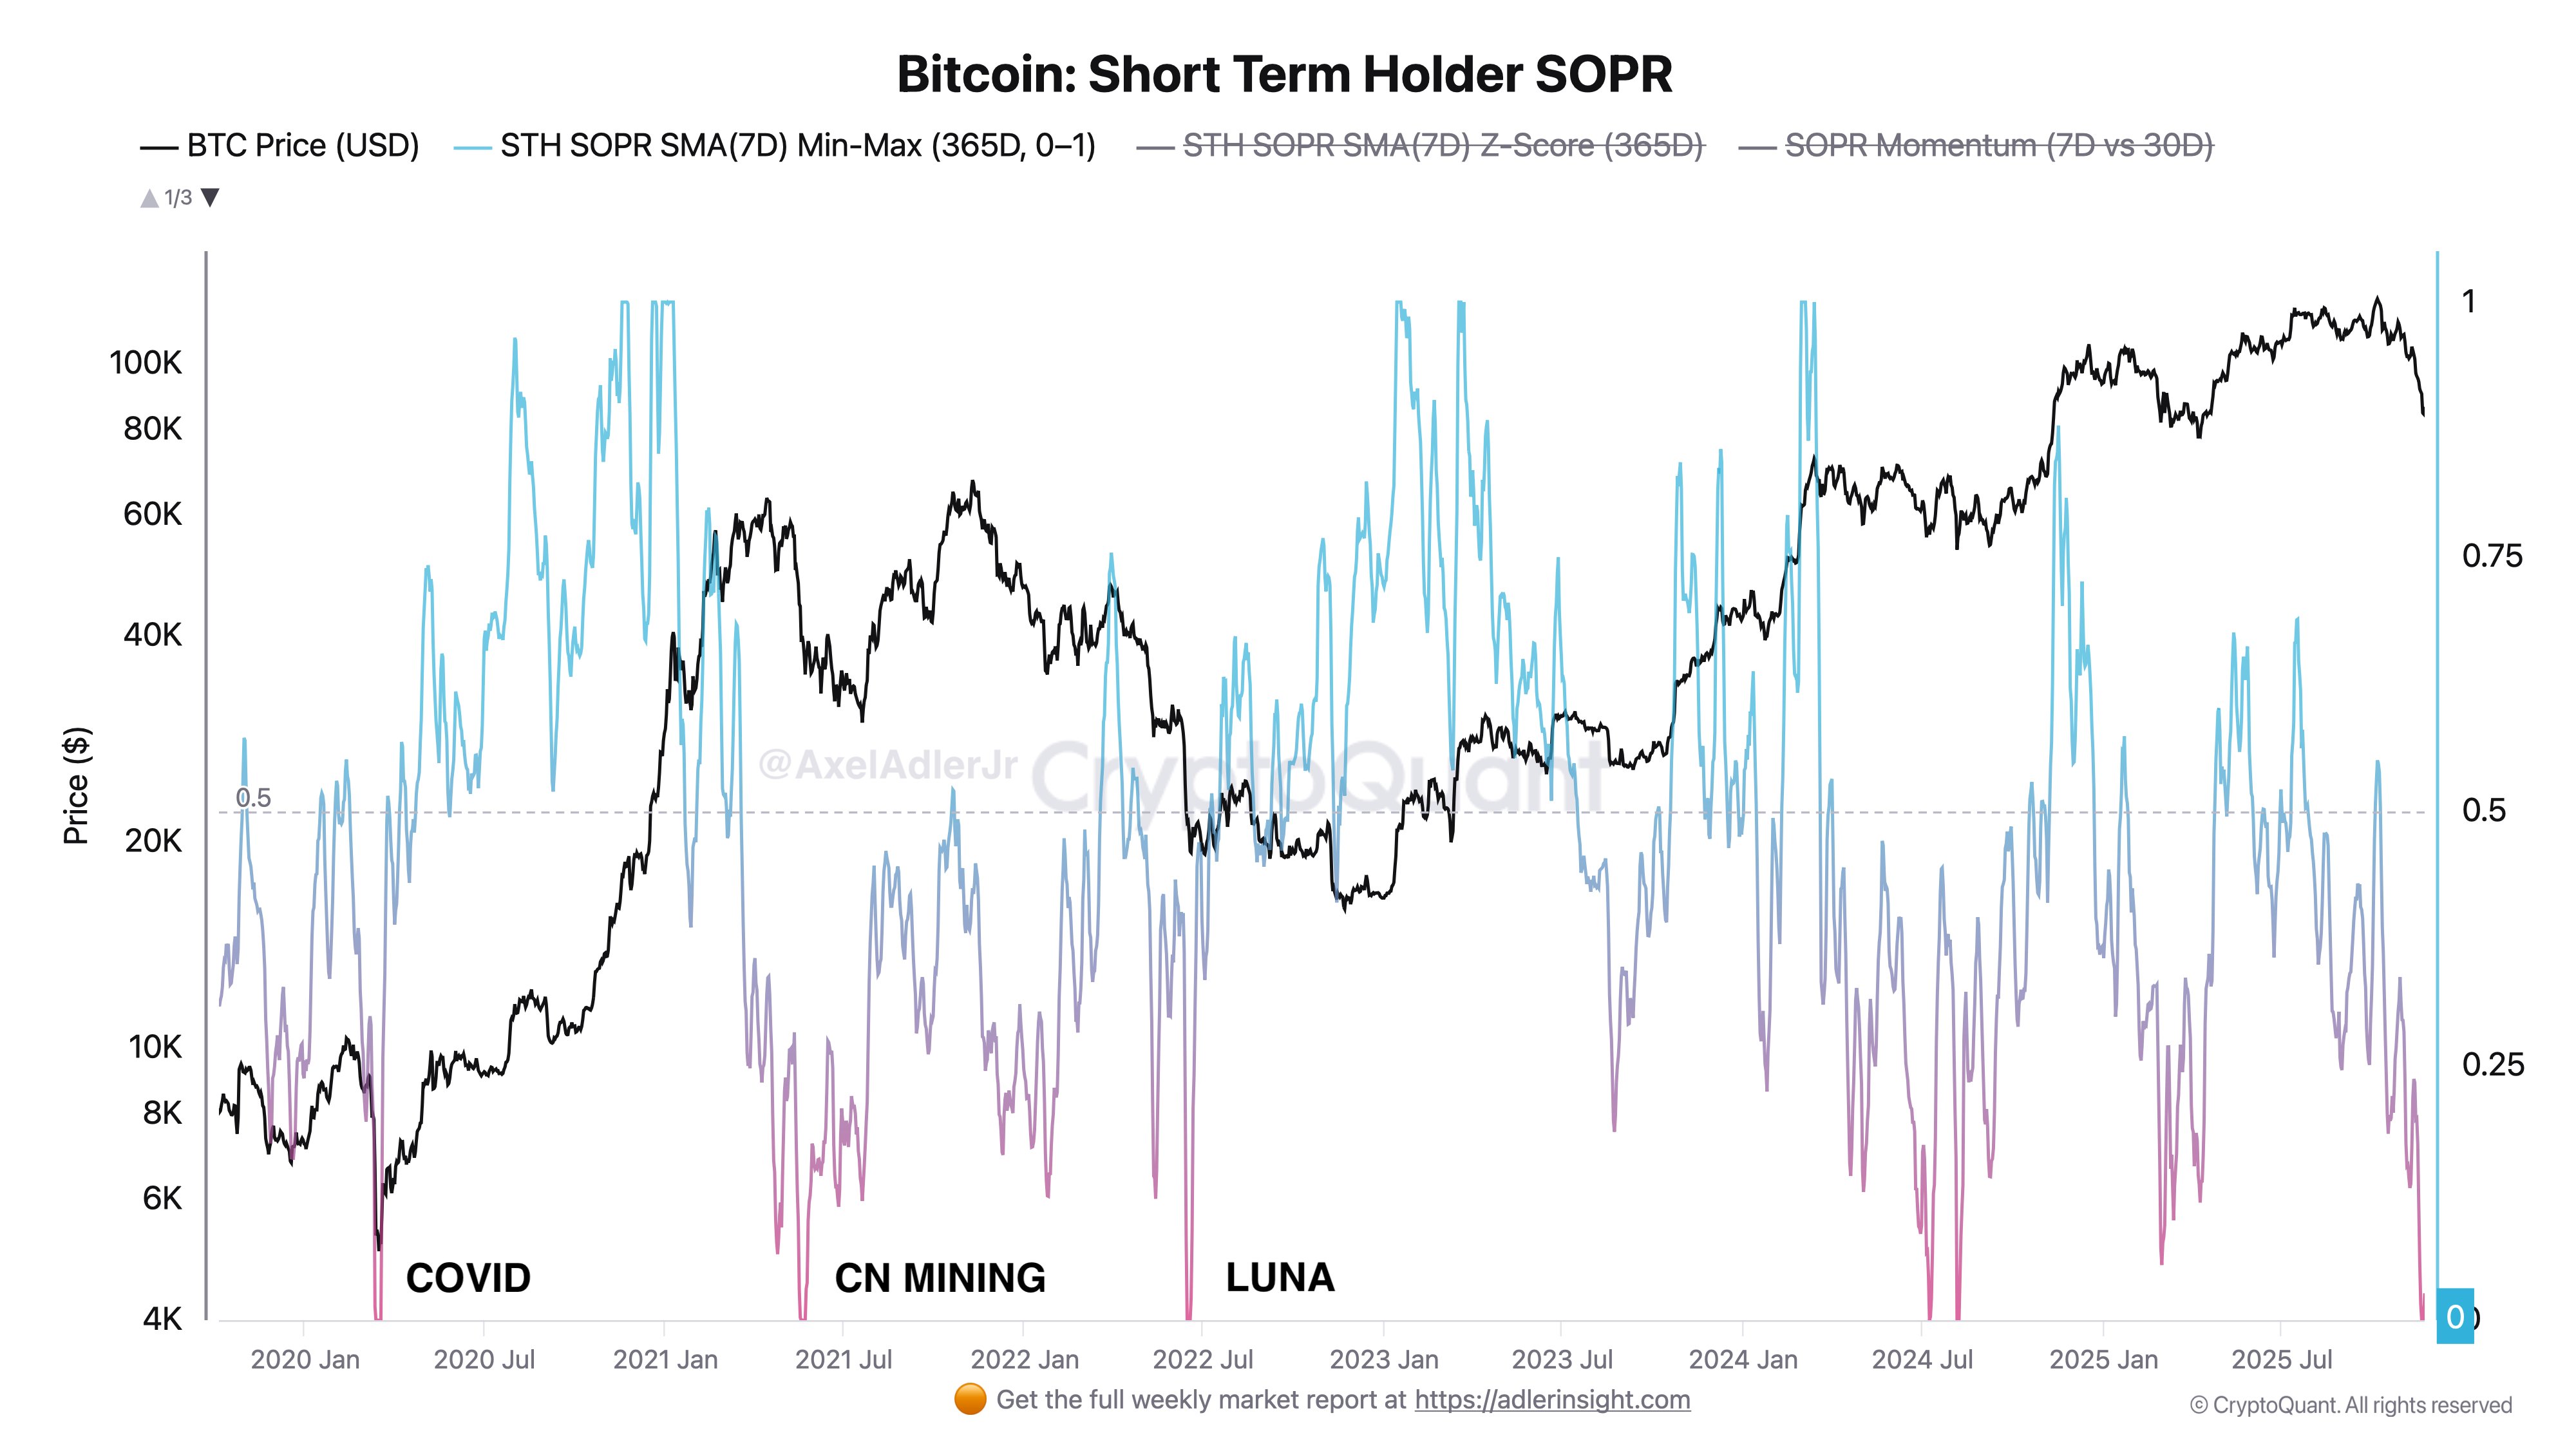
However, Adler emphasizes an important nuance: while behavioral capitulation is clearly underway, macro forces currently dominate market structure. Extreme SOPR readings can produce bottoms, but they can also generate short-lived bounces within broader downtrends when macro conditions remain unfavorable. With the dollar index (DXY) still elevated above 100, liquidity remains tight — and Bitcoin continues to trade under pressure.
Adler notes that everything now hinges on the Federal Reserve. If markets begin actively pricing in the December rate cut, it could weaken the dollar and relieve some of the stress weighing on BTC. Until then, macro remains the stronger force, overshadowing even severe capitulation signals.
Testing Support After a Steep Breakdown
Bitcoin’s price action on the 1D chart shows the market attempting to stabilize after one of the sharpest multi-week declines of this cycle. BTC dropped from the $126,000 peak to the $80,000–$86,000 range in less than two months, and the chart clearly reflects this capitulation structure. The series of long red candles highlights aggressive selling pressure, with bears firmly in control throughout November.

The chart shows BTC trading below all major moving averages—the 50-day, 100-day, and 200-day—confirming a clear breakdown in trend structure. The 200-day MA around the mid-$88K region is now acting as resistance rather than support. This flip is typically a bearish signal and aligns with the ongoing macro-driven weakness highlighted by analysts across the market.
Volume remains elevated during the downturn, reinforcing that the sell-off has been driven by strong hands exiting. However, the most recent candles show wicks forming near $83K–$86K, suggesting early attempts at demand absorption. If BTC can hold above the recent low around $80K and close back above the 200-day MA, the market could see a short-term relief rally.
Featured image from ChatGPT, chart from TradingView.com
