Bitcoin’s Hidden Shift: Why Surging CDD Signals a New Market Paradigm in 2025

Bitcoin's on-chain behavior is rewriting the rules—again. The spike in Coin Days Destroyed (CDD) isn't just noise; it's the sound of old whales waking up. Here's what it means for your portfolio.
The CDD Surge: More Than Just HODLers Cashing Out
When long-dormant coins start moving, markets tremble. Rising CDD suggests early adopters are finally taking profits—or repositioning for the next leg up. Either way, liquidity's shifting.
Cycle Math vs. Human Psychology
Analysts love drawing pretty regression lines, but Bitcoin cycles rhyme, not repeat. This time? Institutional custody solutions and ETF flows are muting historical patterns. The 'number go up' crowd might be in for a volatility sandwich.
The Cynic's Corner
Wall Street still thinks they invented Bitcoin last year—meanwhile, the OGs are quietly recycling capital into privacy coins and DeFi yield farms. Some things never change.
Long-Term Holders Drive Market Dynamics Through Rising CDD
According to Darkfost, the Coin Days Destroyed (CDD) metric remains one of the most valuable tools for understanding Bitcoin’s market structure. It provides a clear visualization of long-term holder (LTH) activity and the potential selling pressure they exert. Essentially, CDD measures how long coins have been held before being moved — and when older coins start circulating again, it’s often a sign that distribution is underway.
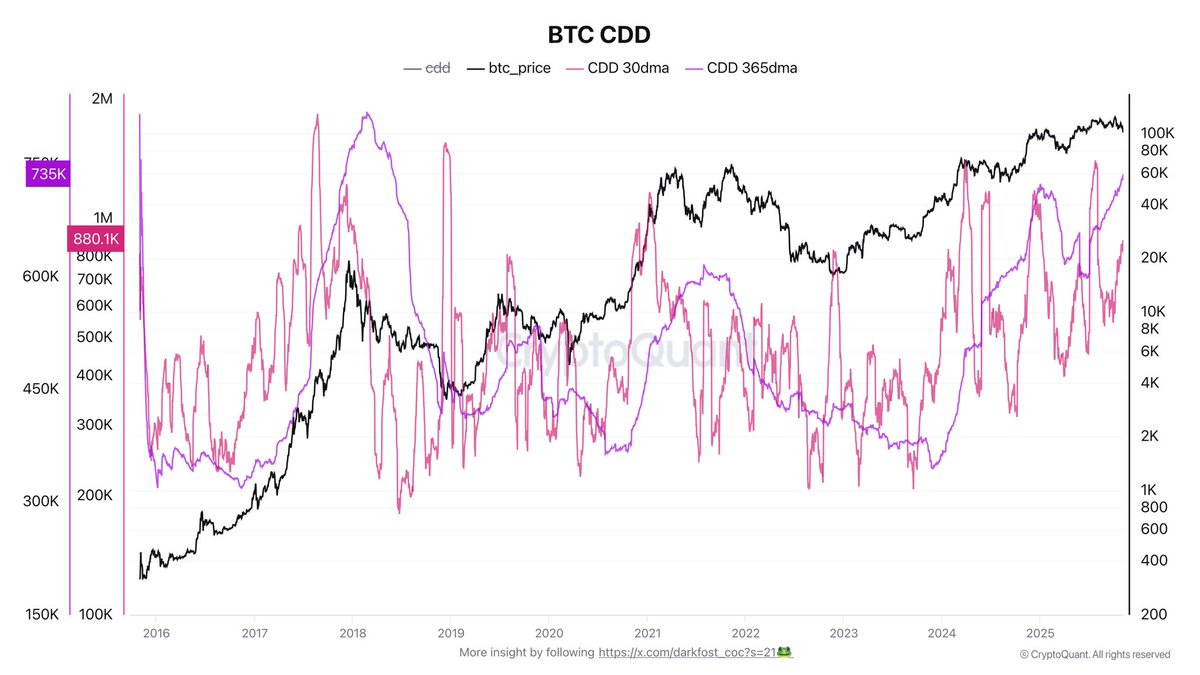
Currently, the 30-day moving average of CDD is steadily rising, having doubled since early summer. Interestingly, this metric declined before Bitcoin’s last all-time high, helping fuel that rally, but it has continued to climb since — reflecting growing LTH activity.
On an annual scale, CDD levels have already surpassed the 2021 cycle and are approaching those from 2017, marking one of the most active long-term holder phases in Bitcoin’s history.
This trend signals a massive transfer of supply between market participants. Despite this, bitcoin remains above $100,000, showing that today’s market is more liquid, resilient, and institutionally driven than in previous cycles. LTHs now have the ability to distribute significant volumes without crashing prices, demonstrating how far Bitcoin’s maturity and market depth have evolved over time.
Bitcoin Battles to Hold $100K Support
Bitcoin is currently trading near $100,767, struggling to maintain stability after a volatile week marked by aggressive selling pressure. The daily chart reveals that BTC has once again tested the $100K psychological support, a key level that bulls must defend to prevent further downside momentum.

From a technical perspective, Bitcoin remains below its 50-day (blue) and 100-day (green) moving averages, signaling that short- and mid-term momentum continues to favor the bears. The 200-day moving average (red) — now positioned slightly above $106K — is acting as dynamic resistance, reinforcing the broader correction phase that began in late October.
If Bitcoin manages to close above $103K–$104K, it could signal a short-term recovery toward $108K–$110K. Conversely, a decisive break below $100K could trigger a sharper correction toward $95K, potentially testing the market’s resilience as sentiment continues to waver between fear and cautious optimism.
Featured image from ChatGPT, chart from TradingView.com
