Bitcoin Battles At $100K Threshold As Short-Term Holder Losses Intensify: SOPR Shows Strain But No Systemic Fear

Bitcoin's $100,000 psychological barrier becomes a battleground as short-term holders bleed—yet the market refuses to break.
The Pressure Cooker
Spent Output Profit Ratio data reveals mounting stress among recent buyers. Losses accumulate like unpaid parking tickets—annoying but not catastrophic. The metric hovers in concerning territory without triggering mass capitulation.
Market Mechanics Holding Firm
Despite the red numbers flashing across rookie portfolios, long-term holders maintain their diamond-handed composure. The $100,000 level transforms into a tug-of-war between weak hands and institutional conviction.
Wall Street's crypto tourists might be sweating, but the OGs? They've seen this movie before—and know how it ends.
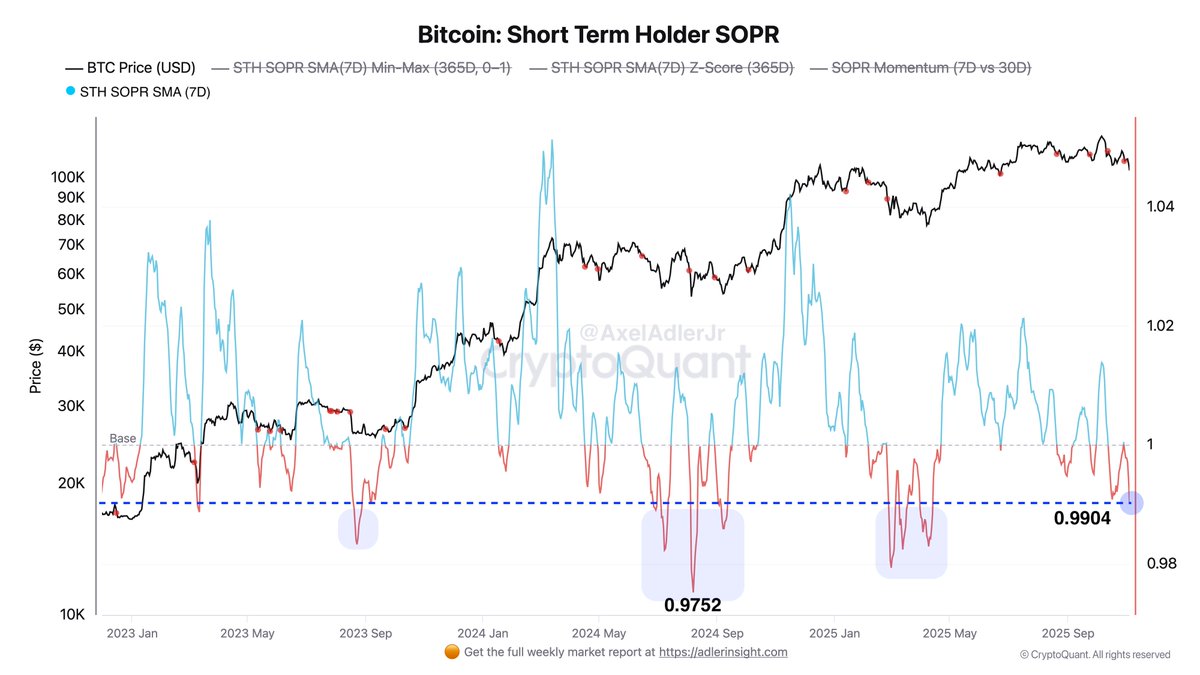
For context, during the heavy correction in August 2024, the STH-SOPR dropped to 0.9752 with a Z-score of −2.43 — a reading consistent with DEEP capitulation. By comparison, today’s metrics reflect pain and fear, but not a full exhaustion of sellers. This important distinction suggests the market may still be in the middle phase of its correction rather than at its terminal point.
Data also shows a steady climb in loss-making activity over recent weeks, illustrating a sustained shift in sentiment as traders unwind positions. While the SOPR momentarily flipped above parity to 1.0005 at the end of October — hinting at attempted recovery — renewed selling in early November quickly invalidated that momentum. Still, metrics have not yet revisited previous extremes.
In essence, the market remains under pressure, but the classic wash-out signal of complete capitulation has not fully triggered — leaving room for either further downside, or a potential stabilization should buyers reclaim control.
Price Action Analysis: Testing Deep Support After Sharp Breakdown
Bitcoin is attempting to stabilize after a sharp breakdown that sent the price below the psychological $100,000 level. The daily chart shows a notable acceleration in selling momentum, with multiple long-bodied bearish candles forming on rising volume — a clear sign of aggressive distribution. After losing the $110,000 region last week, buyers failed to defend the cluster of support around the 100-day and 200-day moving averages, resulting in a swift MOVE down toward deeper demand.

Price briefly dipped under $99,000 before reclaiming the area, suggesting initial buyer interest near these lower supports. However, the recovery so far lacks strength, with candles closing weak and the 50-day and 200-day moving averages now sloping downward above price — a structurally bearish alignment for the short term. The prior key demand zone around $105,000–$107,000 has flipped into resistance, and Bitcoin must reclaim this range to shift momentum.
For now, BTC trades in a vulnerable posture, and failure to build support above $100,000 could expose the next liquidity pocket toward $96,000–$98,000. Still, the sharp volume spike at the lows may indicate early accumulation attempts. A sustained bounce requires buyers to step in decisively and defend current levels as the market tests conviction under stress.
Featured image from ChatGPT, chart from TradingView.com
