Bullish Signal: Binance BTC/Stablecoin Ratio Points to Looming Bitcoin Supply Shock

Get ready for the next Bitcoin surge—the numbers don't lie.
The Warning Shot Heard Across Crypto
Binance's BTC/stablecoin ratio just flashed its most bullish signal since the last halving. When Bitcoin holdings outpace stablecoin reserves on the world's largest exchange, you're looking at a classic supply squeeze in the making.
Mathematics Over Emotions
Traders are hoarding Bitcoin while dumping stablecoins—a move that screams institutional accumulation. The ratio's dramatic shift suggests whales are positioning for what comes next. They're not buying the dip; they're buying the future.
The Coming Crunch
Limited supply meets insatiable demand. Basic economics, really—though Wall Street still struggles with the concept. When available Bitcoin dries up on exchanges, price discovery becomes violent. Upwardly violent.
Remember when traditional finance laughed at digital gold? They're not laughing anymore—they're scrambling to understand ratios that actually predict something useful.
Bitcoin Indicator Flashes Buy Signal For The Third Time This Cycle
According to on-chain analyst Darkfost, the recent market activity has triggered major shifts within Binance reserves, both in stablecoins and BTC holdings. Amid the post-liquidation recovery, one clear trend has emerged from the noise: the BTC/Stablecoin reserve ratio on Binance is now flashing a buy signal for the third time this cycle—a pattern that has historically preceded strong upward moves in Bitcoin’s price.
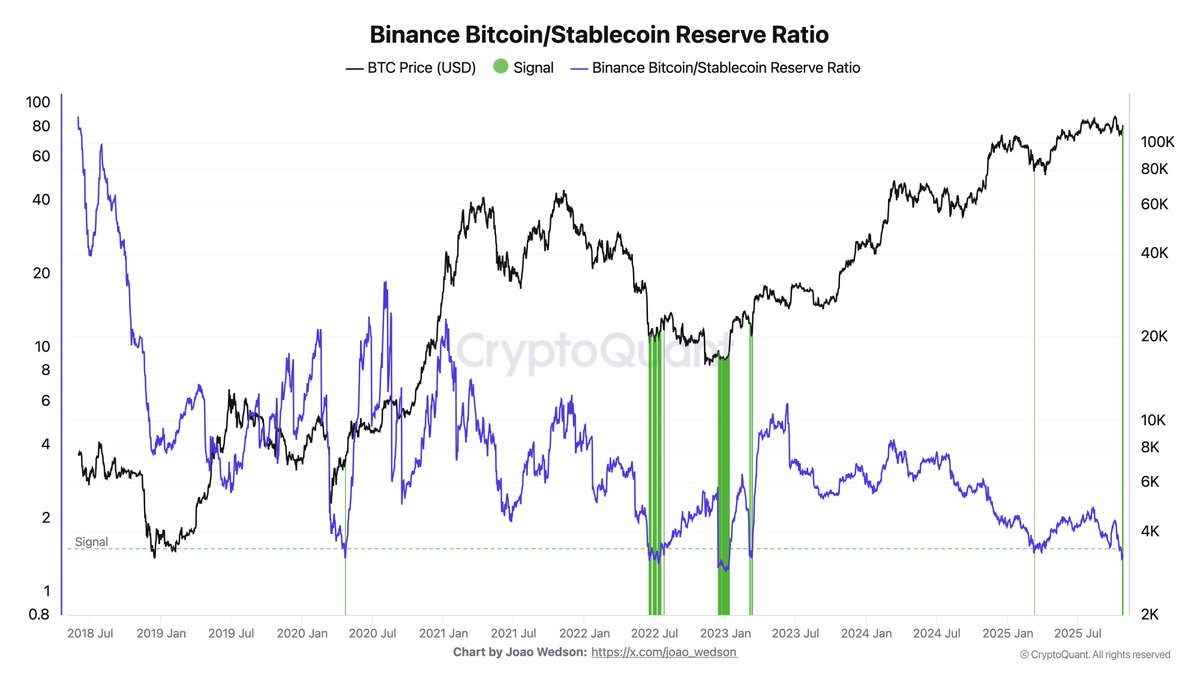
Darkfost notes that this same signal has appeared at critical turning points in the past. In January 2023, bitcoin rallied from $16,600 to $24,800. The second instance, in March 2023, preceded a surge from $20,300 to $73,000, marking the beginning of a major bullish phase. The most recent occurrence, in March 2025, was followed by another substantial move from $78,600 to $123,500.
This recurring signal reflects a structural change within Binance’s reserves: stablecoin holdings are increasing relative to BTC reserves. In other words, there is a growing amount of stablecoins ready to enter the market while BTC reserves continue to fall. Such a dynamic often creates conditions for a supply shock, where buying demand begins to outpace available supply, setting the stage for a potential bullish reversal.
What makes this setup particularly notable is its context. This pattern usually forms during bear markets or following deep corrections, when accumulation phases begin to rebuild market strength. Seeing it develop now—while Bitcoin consolidates NEAR key support levels—is unusual and suggests that large holders and institutional participants may already be positioning for the next major upward phase.
Bitcoin Faces Resistance As Bulls Attempt To Reclaim Momentum
Bitcoin (BTC) is consolidating around $112,900, showing early signs of recovery after bouncing from its 200-day moving average (red line) near $108,000. The price structure suggests that BTC is attempting to regain bullish momentum but continues to face notable resistance at $117,500, a level that has capped multiple rallies since late August.

The 50-day (blue) and 100-day (green) moving averages currently converge around $114,000–$115,000, reinforcing this zone as a short-term barrier. A clean break and daily close above this area WOULD confirm renewed buying strength and potentially trigger a move toward $120,000–$123,000, where prior liquidity clusters exist.
On the downside, the 200-day MA remains the critical support to monitor. As long as Bitcoin holds above it, the broader uptrend structure remains intact, despite recent volatility. A close below $108,000, however, could expose BTC to a deeper correction toward $102,500, where the next significant support lies.
Market participants appear cautious ahead of the Federal Reserve meeting this Wednesday, with traders balancing macro uncertainty against improving on-chain metrics. The ongoing consolidation may therefore act as a pre-breakout accumulation phase, with a decisive MOVE likely to follow once policy clarity and liquidity direction are established.
Featured image from ChatGPT, chart from TradingView.com
