Bitcoin Whale Makes Bold Move: Deposits 5,252 BTC While Shorting Additional 2,100 BTC

Crypto markets brace as veteran Bitcoin holder executes massive transfer and doubles down on bearish bet.
The Whale's Two-Front Strategy
In a move that's shaking crypto circles, a Bitcoin original gangster just deposited 5,252 BTC to exchanges while simultaneously opening a 2,100 BTC short position. This dual-action play suggests the whale expects immediate downside despite long-term bullishness—or maybe they just enjoy watching traders scramble to decode their intentions.
Market Impact Analysis
The deposit alone represents significant selling pressure, but the additional short position amplifies the bearish signal. Such large-scale movements typically trigger copycat trading and increased volatility across crypto derivatives markets.
Timing the Turbulence
With Bitcoin hovering at critical levels, this whale's coordinated action could either prove prescient or become another cautionary tale about over-leveraged positions. Because nothing says 'smart money' like betting against your own holdings while the entire market watches.
Whale Activity Intensifies: The BitcoinOG Moves Millions Across Exchanges
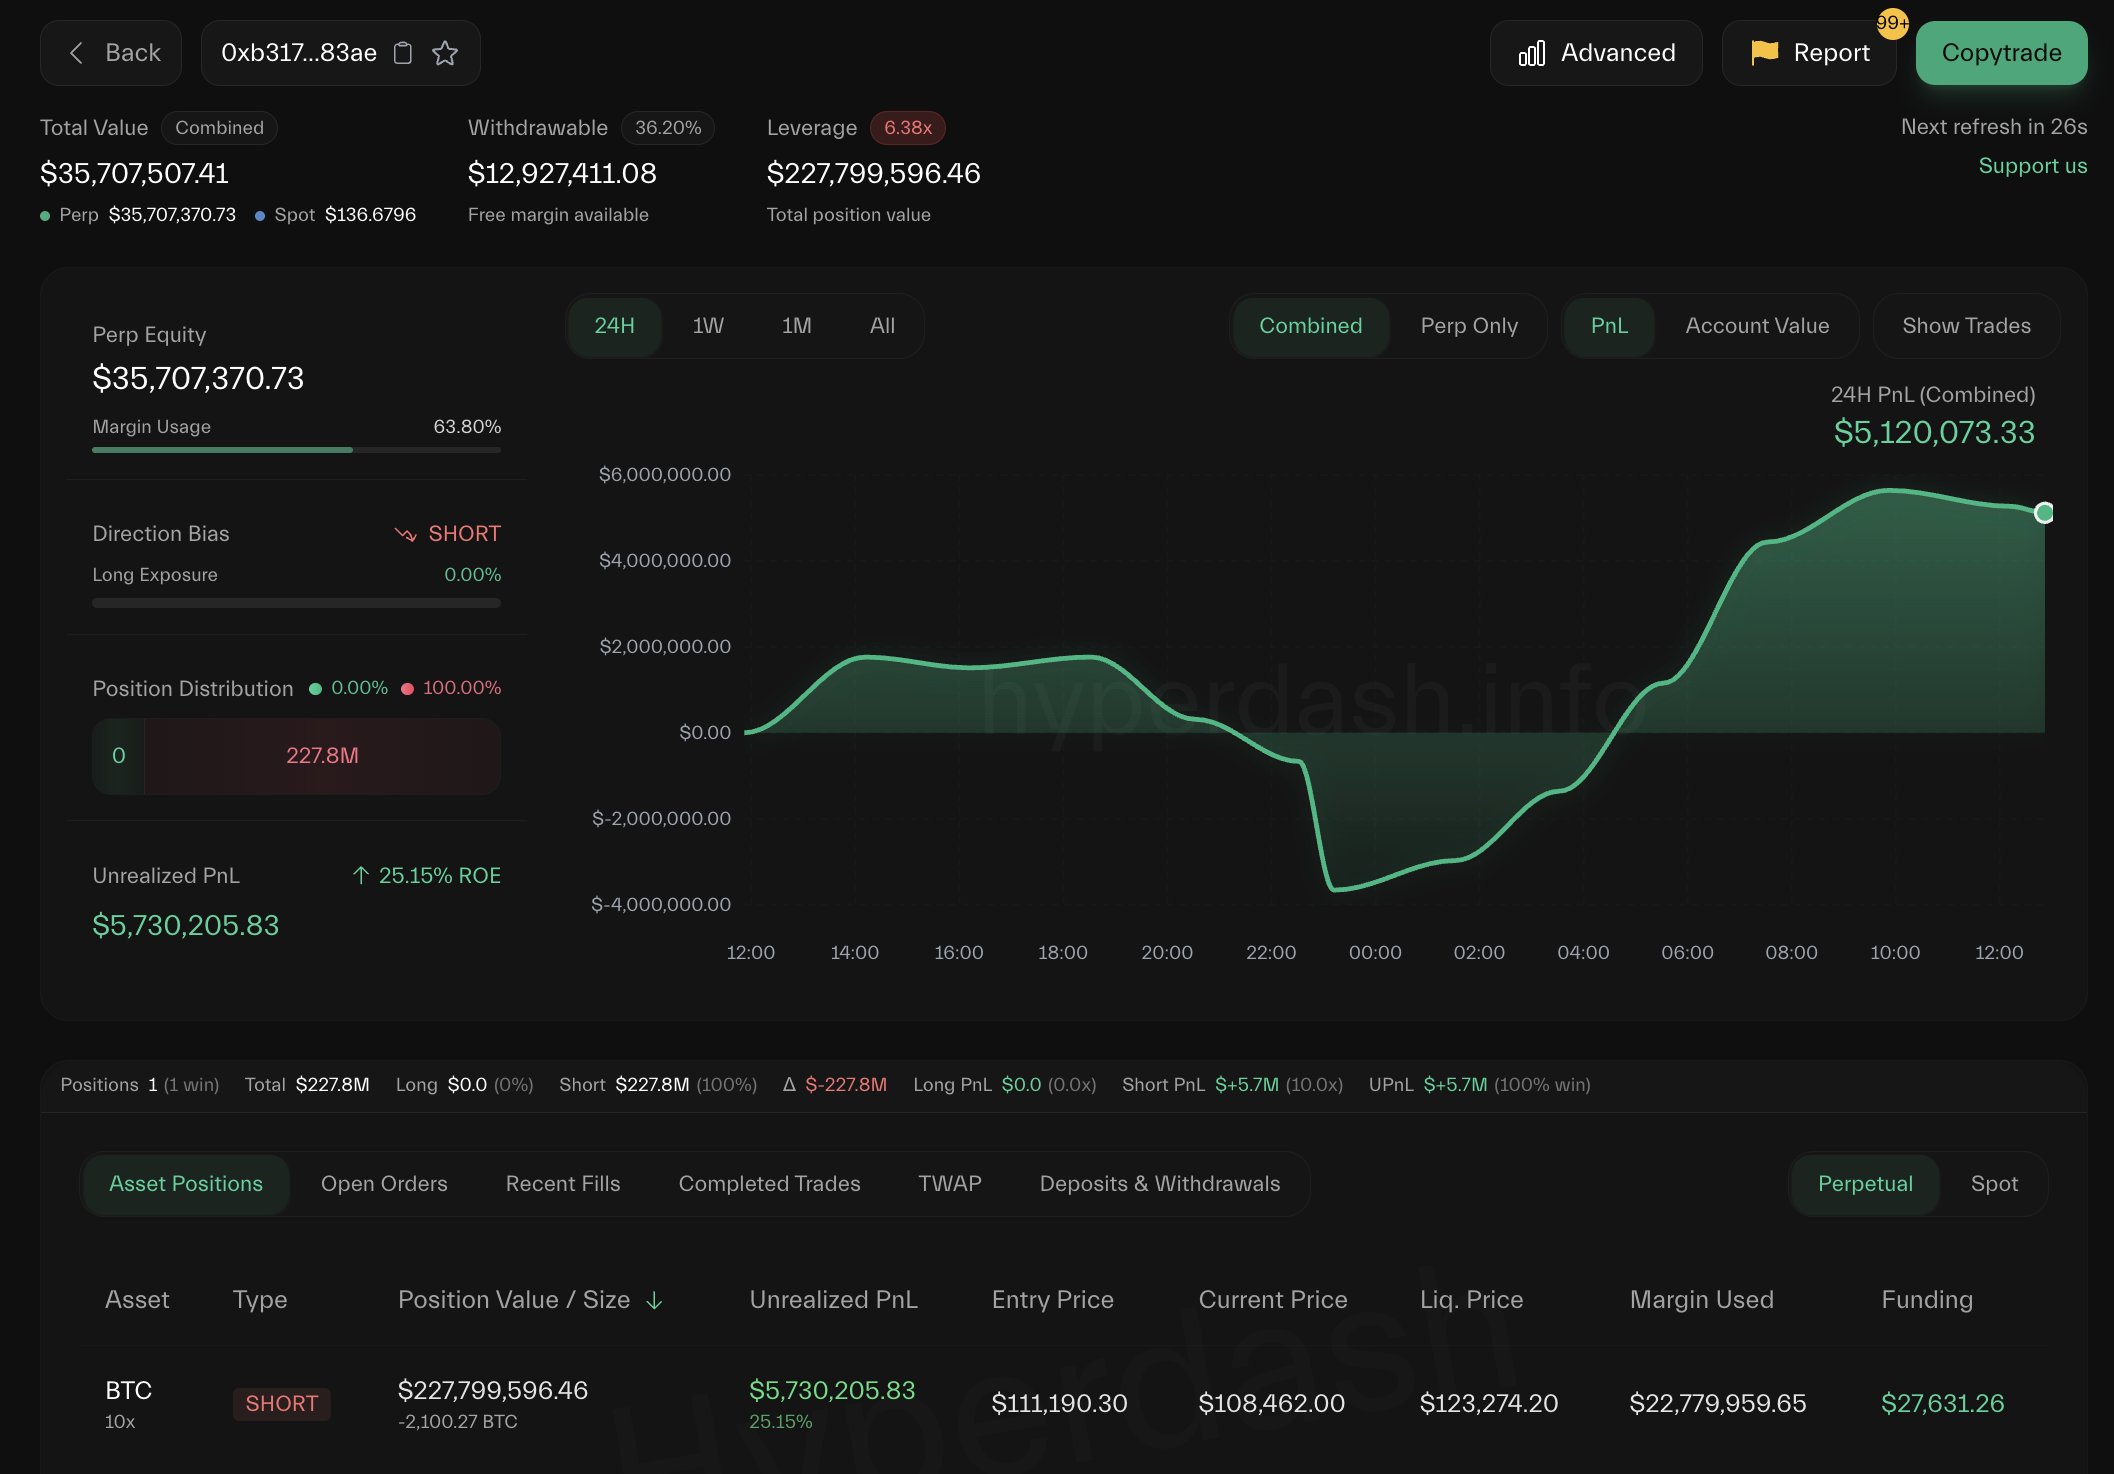
According to Lookonchain insights, the BitcoinOG (1011short) — the trader who famously shorted the market during the October 10 crash — is once again making major moves. Since the market downturn, this whale has deposited 5,252 BTC, worth approximately $587.88 million, into major exchanges including Binance, Coinbase, and Hyperliquid. At the same time, data shows his short position on Hyperliquid has grown to 2,100 BTC, valued at around $227.8 million.
This scale of activity has drawn intense attention from analysts, given the trader’s historical accuracy in predicting market tops. Depositing Bitcoin to exchanges often signals potential selling or hedging behavior, adding to the bearish tone currently dominating sentiment. Combined with the expansion of his short exposure, it suggests the whale could be positioning for further downside or protecting gains from earlier market moves.
However, several experts have urged caution in overinterpreting these transactions. On-chain visibility only provides a partial view — these may be just a fraction of the whale’s total holdings or broader strategy. It’s possible that some positions remain hidden across other derivatives platforms, wallets, or over-the-counter deals.
This uncertainty makes the whale’s behavior both intriguing and concerning. While retail traders often react strongly to such visible movements, seasoned analysts emphasize the need for broader context — including derivatives data, funding rates, and liquidity shifts.
Weekly Chart: Support Retest as Market Faces Key Inflection Point
The weekly bitcoin chart shows the market struggling to hold above the $108,000 region, a critical short-term support level that aligns closely with the 50-week moving average (blue line). After the sharp drop following the October 10 crash, BTC attempted a rebound but failed to sustain momentum above $114,000, signaling persistent selling pressure near the $117,500 resistance — a level that has acted as both support and resistance multiple times over the past year.

The structure now suggests Bitcoin is in a consolidation phase within a broader bullish trend, but downside risks remain elevated. If the 50-week moving average fails to hold, the next potential support lies NEAR $100,000, which aligns with the lower range of historical demand and the March 2025 breakout zone. A break below this region could accelerate selling momentum and confirm a deeper retracement.
Conversely, reclaiming $117,500 WOULD signal renewed strength, opening the door for a potential retest of the $125,000–$130,000 range. Overall, Bitcoin’s weekly structure remains cautiously bullish, but sustained weakness around current levels would put the broader uptrend at risk — making the coming weeks decisive for long-term direction.
Featured image from ChatGPT, chart from TradingView.com
